Advertisements
Advertisements
Question
Explain the concepts of variation and changes in demand with the help of diagrams.
Solution
A. Variations in Demand: When the demand for a commodity falls or rises due to a change in price alone and other factors remain constant. it is called variations in demand. It is of two types:
(1) Expansion of demand: Expansion of demand refers to the rise in quantity demanded due to falling in price alone while other factors like tastes, the income of the consumer, size of the population, etc. remain unchanged. Demand moves in a downward direction on the same demand curve. This is explained with the help of the following figure.
Expansion of Demand
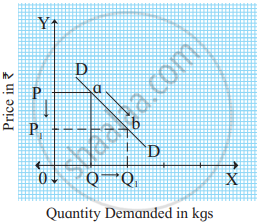
As shown in the figure, DD is the demand curve. A downward movement on the same demand curve from point a to point b indicates an expansion of demand.
(2) Contraction of Demand: Contraction of demand refers to a fall in demand due to a rise in price alone. Other factors like tastes, the income of the consumer, the size of the population, etc. remain unchanged. The demand curve moves in the upward direction on the same demand curve. This can be explained with the help of the following figure.
Contraction of Demand
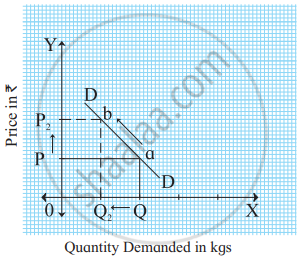
As shown in the figure, DD is a demand curve. An upward movement on the same demand curve from point a to point b shows a contraction of demand.
B. Changes in Demand: When demand for commodity increases or decreases due to changes in other factors and the price remains constant, it is known as a change in demand. It is of two types:
(1) Increase in demand: It refers to an increase in quantity demanded due to favourable changes in other factors like tastes, the income of the consumer, climatic conditions, etc., and the price remains constant. Demand curve shifts to the right-hand side of the original demand curve. This can be explained with the help of a figure.
Increase in Demand
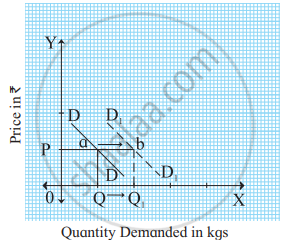
As shown in the figure, DD is the original demand curve. The demand curve shifts outward to the right from DD to D1D1 which indicates an increase in demand.
(2) Decrease in demand: It refers to a decrease in quantity demanded due to unfavourable changes in other factors like tastes, the income of the consumer, climatic conditions, etc, and the price remains constant. Demand curve shifts to the left-hand side of the original demand curve. This can be explained with the help of a figure.
Decrease in Demand
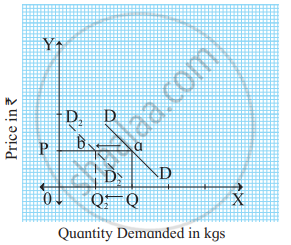
As shown in the figure, DD is the original demand curve. It shifts inward to the left from DD to D2D2 which indicates a decrease in demand.
APPEARS IN
RELATED QUESTIONS
Distinguish between:
Expansion of demand and Contraction of demand.
Explain the diagram:
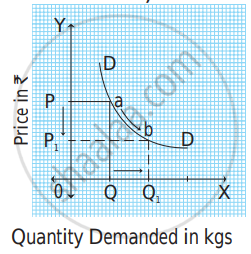
- The diagram represents _______ in demand.
- In the diagram, A movement of the demand curve is in ______ direction.
Explain the diagram:

- The diagram represents ______ in demand.
- In the diagram, the movement of the demand curve is in ______ direction.
Give economic terms:
A situation where more quantity is demanded at a lower price.
Distinguish between:
Expansion of demand and Contraction of demand
Give an economic term:
Other factors remain constant, demand falls due to a rise in price.
Complete the correlation:
Rise in price : Contraction of demand : : Fall in price : ______.
When less units are demanded at high price it shows ______.
