Advertisements
Advertisements
Question
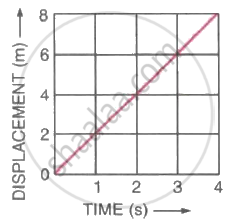
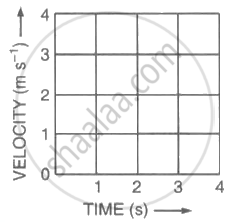
Figure (a) shows the displacement-time graph for the motion of a body. Use it to calculate the velocity of the body at t = 1 s, 2 s and 3 s, and then draw the velocity-time graph in Figure (b) for it.
 |
 |
| (a) | (b) |
Solution
We observe from the given displacement time graph above, that the slope is a straight line inclined with time axis, so the body is moving with uniform velocity.
velocity = Slope of straight line
t = 1; velocity = `2/1` = 2 m/s
t = 2; velocity = `4/2` = 2 m/s
t = 3; velocity = `6/3` = 2 m/s
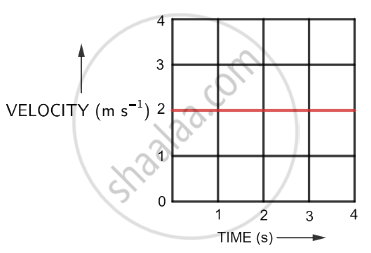
Hence, velocity at t = 1 s, 2 s and 3 s is equal to 2 m s-1
Velocity-time graph for the motion of a body is given below:
APPEARS IN
RELATED QUESTIONS
What can you say about the motion of an object whose distance-time graph is a straight line parallel to the time axis?
A driver of a car travelling at 52 km h−1 applies the brakes and accelerates uniformly in the opposite direction. The car stops in 5 s. Another driver going at 3 km h−1 in another car applies his brakes slowly and stops in 10 s. On the same graph paper, plot the speed versus time graphs for the two cars. Which of the two cars travelled farther after the brakes were applied?
The speed-time graph for a car is shown in the following figure:
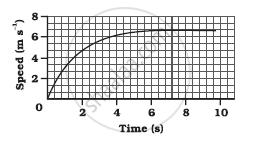
- Find how far the car travels in the first 4 seconds. Shade the area on the graph that represents the distance travelled by the car during the period.
- Which part of the graph represents uniform motion of the car?
Show the shape of the distance-time graph for the motion in the following case:
A car moving with a constant speed.
Figure shows the distance-time graph for the motion of two vehicles A and B. Which one of them is moving faster?
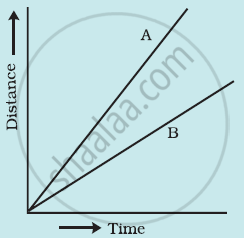
Figure: Distance-time graph for the motion of two cars
The graph given alongside shows the positions of a body at different times. Calculate the speed of the body as it moves from :
(1) A to B,
(2) B to C, and
(3) C to D.

A student draws a distance-time graph for a moving scooter and finds that a section of the graph is horizontal line parallel to the time axis. Which of the following conclusion is correct about this section of the graph?
Two students were asked to plot a distance-time graph for the motion described in Table A and Table B.
Table A
| Distance moved (m) | 0 | 10 | 20 | 30 | 40 | 50 |
| Time (minutes) | 0 | 2 | 4 | 6 | 8 | 10 |
Table B
| Distance moved (m) | 0 | 5 | 10 | 15 | 20 | 25 |
| Time (minutes) | 0 | 1 | 2 | 3 | 4 | 5 |
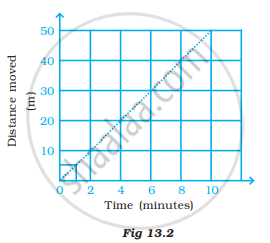
The graph given in Figure 13.2 is true for
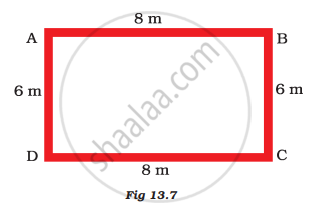
Starting from A, Paheli moves along a rectangular path ABCD as shown in Figure 13.7. She takes 2 minutes to travel each side. Plot a distance-time graph and explain whether the motion is uniform or non-uniform.
What do you infer if
- Distance – time graph is a straight line.
- The velocity-time graph is curved.
- Displacement time is zigzag.
