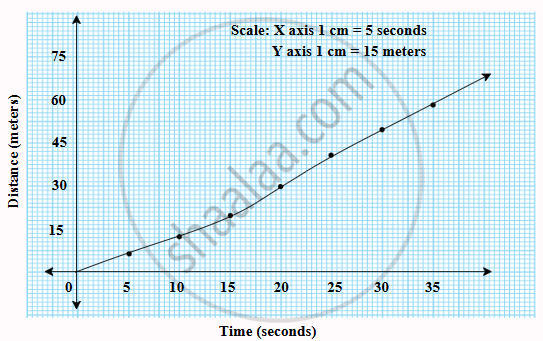
The table shows the distances covered by a car in fixed time intervals.
| Time (seconds) | Distance (metres) |
|---|---|
| 0 | 0 |
| 10 | 15 |
| 20 | 30 |
| 30 | 45 |
| 40 | 60 |
| 50 | 75 |
| 60 | 90 |
| 70 |
105 |
To represent this data, we plot a graph with time on the X-axis and distance on the Y-axis.
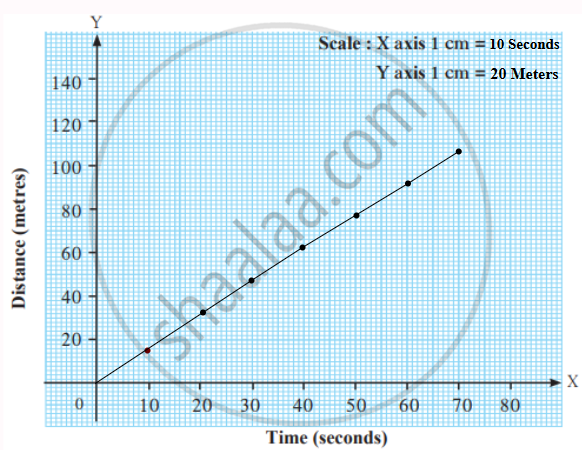
Distance-time graph
The graph shows a straight line, which indicates uniform motion, meaning the car covers equal distances in equal time intervals. Uniform motion graphs are always straight lines, as the rate of change of distance with time remains constant.