Advertisements
Advertisements
Question
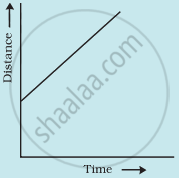
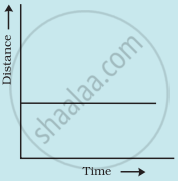
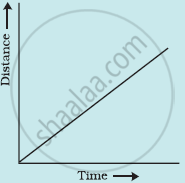
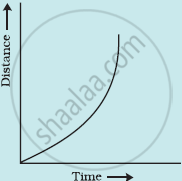
Which of the following distance-time graphs shows a truck moving with speed which is not constant?
Options
Solution
Explanation:
- In a distance-time graph, the constant speed of a truck will be represented by a straight line.
- In a distance-time graph, a straight line parallel to the time axis indicates that the truck is not moving.
- A curved line on a distance-time graph indicates that the truck is moving at a speed that is not constant.
APPEARS IN
RELATED QUESTIONS
Name the two quantities, the slope of whose graph give speed .
The graph given alongside shows the positions of a body at different times. Calculate the speed of the body as it moves from :
(1) A to B,
(2) B to C, and
(3) C to D.

The slope of the distance-time graph at any point gives______.
Two students were asked to plot a distance-time graph for the motion described in Table A and Table B.
Table A
| Distance moved (m) | 0 | 10 | 20 | 30 | 40 | 50 |
| Time (minutes) | 0 | 2 | 4 | 6 | 8 | 10 |
Table B
| Distance moved (m) | 0 | 5 | 10 | 15 | 20 | 25 |
| Time (minutes) | 0 | 1 | 2 | 3 | 4 | 5 |
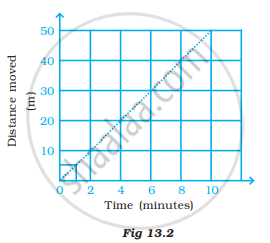
The graph given in Figure 13.2 is true for
Complete the data of the table given below with the help of the distance-time graph given in Figure 13.6
| Distance (m) | 0 | 4 | ? | 12 | ? | 20 |
| Time (s) | 0 | 2 | 4 | ? | 8 | 10 |

The distance between Bholu’s and Golu’s house is 9 km. Bholu has to attend Golu’s birthday party at 7 o’clock. He started from his home at 6 o’clock on his bicycle and covered a distance of 6 km in 40 minutes. At that point, he met Chintu and spoke to him for 5 minutes and reached Golu’s birthday party at 7 o’clock. With what speed did he cover the second part of the journey? Calculate his average speed for the entire journey.
Boojho goes to the football ground to play football. The distance-time graph of his journey from his home to the ground is given in Figure 13.9.
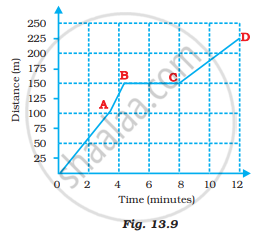
(a) What does the graph between points B and C indicate about the motion of Boojho?
(b) Is the motion between 0 to 4 minutes uniform or nonuniform?
(c) What is his speed between 8 and 12 minutes of his journey?
The slope of the distance-time graph indicates the speed.
Assertion: The slope of the distance-time graph of a body moving with high speed is steeper than the slope of the distance-time graph of a body with low velocity.
Reason: Slope of distance-time graph = speed of the body.
What do you infer if
- Distance – time graph is a straight line.
- The velocity-time graph is curved.
- Displacement time is zigzag.
