Advertisements
Advertisements
Question
Boojho goes to the football ground to play football. The distance-time graph of his journey from his home to the ground is given in Figure 13.9.
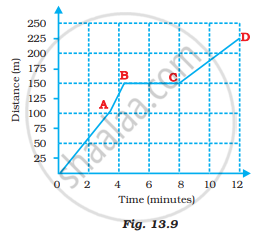
(a) What does the graph between points B and C indicate about the motion of Boojho?
(b) Is the motion between 0 to 4 minutes uniform or nonuniform?
(c) What is his speed between 8 and 12 minutes of his journey?
Solution
(a) Graph between points B and C is a horizontal line that indicates that Boojho is at rest, i.e. his speed is zero.
(b) Motion between 0 to 4 minutes is non-uniform as distance-time graph for this time interval is not a straight line.
(c) Speed of Boojho between 8 and 1 minutes of his journey
= `((225 - 150)"m')/((12 - 8)"min")`
= `75/4`
= 18.75 m/min
APPEARS IN
RELATED QUESTIONS
Given figure shows the distance-time graph of three objects A, B and C. Study the graph and answer the following questions:
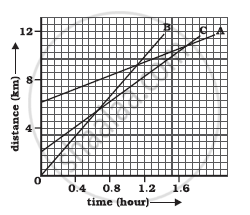
- Which of the three is travelling the fastest?
- Are all three ever at the same point on the road?
- How far has C travelled when B passes A?
- How far has B travelled by the time it passes C?
The speed-time graph for a car is shown in the following figure:
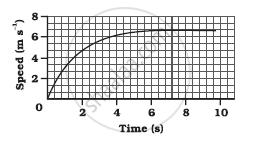
- Find how far the car travels in the first 4 seconds. Shade the area on the graph that represents the distance travelled by the car during the period.
- Which part of the graph represents uniform motion of the car?
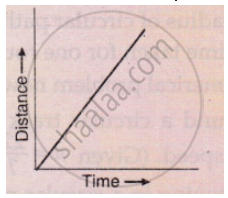
What conclusion can you draw about the speed of a body from the following distance-time graph ?
What can you say about the motion of a body whose distance-time graph is a straight line parallel to the time axis ?
Show the shape of the distance – time graph for the motion in the following cases.
- A bus moving with a constant speed.
- A car parked on a road side.
The slope of the distance-time graph at any point gives______.
Two students were asked to plot a distance-time graph for the motion described in Table A and Table B.
Table A
| Distance moved (m) | 0 | 10 | 20 | 30 | 40 | 50 |
| Time (minutes) | 0 | 2 | 4 | 6 | 8 | 10 |
Table B
| Distance moved (m) | 0 | 5 | 10 | 15 | 20 | 25 |
| Time (minutes) | 0 | 1 | 2 | 3 | 4 | 5 |
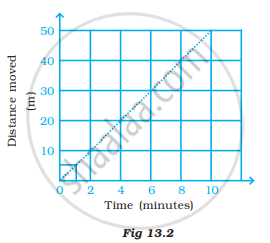
The graph given in Figure 13.2 is true for
Complete the data of the table given below with the help of the distance-time graph given in Figure 13.6
| Distance (m) | 0 | 4 | ? | 12 | ? | 20 |
| Time (s) | 0 | 2 | 4 | ? | 8 | 10 |

The slope of the distance-time curve is steeper/greater is the ______.
What do you infer if
- Distance – time graph is a straight line.
- The velocity-time graph is curved.
- Displacement time is zigzag.
