Advertisements
Advertisements
Question
The distance between Bholu’s and Golu’s house is 9 km. Bholu has to attend Golu’s birthday party at 7 o’clock. He started from his home at 6 o’clock on his bicycle and covered a distance of 6 km in 40 minutes. At that point, he met Chintu and spoke to him for 5 minutes and reached Golu’s birthday party at 7 o’clock. With what speed did he cover the second part of the journey? Calculate his average speed for the entire journey.
Solution
Distance between Bholu’s and Golu’s house = 9 km
Distance covered by Bholu in the first part of the journey
= 6 km
Time is taken to cover 6 km = 40 min
Distance covered by Bholu in the second part of the journey
= 9 − 6
= 3 km
Time is taken to cover 3 km
= 60 – (40 + 5)
=15 min
Speed of Bholu while covering the second part of the journey = `(3"km")/((15/60)"h")`
= 12 km/h
The average speed of Bholu for the entire journey
= `("Total distance")/("Time taken")`
= `(9"km")/(60 "min")`
= 9 km/h
APPEARS IN
RELATED QUESTIONS
What is the nature of the distance-time graphs for uniform and non-uniform motion of an object?
A driver of a car travelling at 52 km h−1 applies the brakes and accelerates uniformly in the opposite direction. The car stops in 5 s. Another driver going at 3 km h−1 in another car applies his brakes slowly and stops in 10 s. On the same graph paper, plot the speed versus time graphs for the two cars. Which of the two cars travelled farther after the brakes were applied?
What does the slope of a distance-time graph indicate ?
The graph given alongside shows the positions of a body at different times. Calculate the speed of the body as it moves from :
(1) A to B,
(2) B to C, and
(3) C to D.

Four cars A, B, C and D are moving on a levelled, straight road. Their distance-time graphs are shown in the given figure. Which of the following is the correct statement regarding the motion of these cars?
Show the shape of the distance – time graph for the motion in the following cases.
- A bus moving with a constant speed.
- A car parked on a road side.
What are the uses of the graphical study of motion?
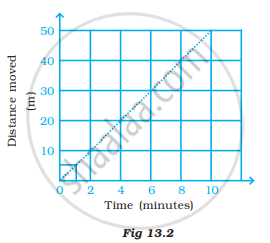
Two students were asked to plot a distance-time graph for the motion described in Table A and Table B.
Table A
| Distance moved (m) | 0 | 10 | 20 | 30 | 40 | 50 |
| Time (minutes) | 0 | 2 | 4 | 6 | 8 | 10 |
Table B
| Distance moved (m) | 0 | 5 | 10 | 15 | 20 | 25 |
| Time (minutes) | 0 | 1 | 2 | 3 | 4 | 5 |

The graph given in Figure 13.2 is true for
The slope of the distance-time graph indicates the speed.
What do you infer if
- Distance – time graph is a straight line.
- The velocity-time graph is curved.
- Displacement time is zigzag.
