Advertisements
Advertisements
Question
How is Hardy-Weinberg's expression “(p2 + 2pq + q2) = 1” derived?
Solution
Sum total of all the allelic frequencies is 1. Let there be two alleles A and a in a population. The frequencies of alleles A and a are ‘p’ and ‘q’ respectively.
The frequency of AA individuals in a population is p2 and it can be explained that the probability that an allele A with a frequency of p would appear on both the chromosomes of a diploid individual is simply the product of the probabilities, i.e., p2.
Similarly, the frequency of aa is q2 and that of Aa is 2pq.
(p2 + 2pq + q2) = 1 where p2 represents the frequency of the homozygous dominant genotype, 2pq represents the frequency of the heterozygous genotype and q2 represents the frequency of the homozygous recessive.
APPEARS IN
RELATED QUESTIONS
Give the graphical representation of Hardy· Weinberg's principle in the form of Punnet Square.
How does the Hardy-Wienberg equation explain genetic equilibrium?
Multiple choice question.
In Hardy - Weinberg equation, the frequency of homozygous recessive individual is represented by:
A population will not exist in Hardly Weiberg equilibrium if ____________.
How does Hardy-Weinberg’s expression (p2+2pq+q2=1) explain that genetic equilibrium is maintained in a population? List any four factors that can disturb the genetic equilibrium.
In the Hardy-Weinberg equilibrium equation, the homozygous mutant is represented as ______.
The factor that leads to the Founder effect in a population is ______
List any two factors that can disturb the genetic equilibrium.
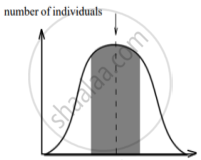
The graphs below show three types of natural selection. The shaded areas marked with arrows show the individuals in the population who are not selected. The dotted vertical lines show the statistical means.
 |
 |
 |
| character Graph A |
character Graph B |
character Graph C |
- What names are given to the types of selection shown in graphs A, B and C?
- After the selection has operated for several generations in the above populations indicated as, Graph A, B and C, graphically illustrate the probable results.
A population of 200 fruit flies is in Hardy Weinberg equilibrium. The frequency of the allele (a) 0.4. Calculate the following:
The number of homozygous recessive fruit flies.
