Advertisements
Advertisements
Question
Look at the graph and the paragraph below which provides an interpretation of the data given in the graph.
Graph to show number of whales caught in Antarctic (1985-2010)

As whalers reduced catching of the large/r whales, they switched to smaller species. This is evident when we compare figures for the Antarctic catch of the larger sei whale with those for small minke whale. In 1985, fifteen times as many sei whales as minke whales were caught. By 1995, catches of both the species were virtually the same (9000). By the 2000, the situation had reversed and the number of minke whales killed more than doubled as compared to sei whales (6000). The graph shows that while the sei catch was reduced by 95% between 1985 and 2010, over the same period the minke whale catch was eight times greater. If these trends continue, the situation for the smaller species will be as bad as it used to be for the larger ones.
Discuss with a partner:
1. What expressions have been used for comparing the data? Underline them.
2. Does the analysis identify the main trends? Has any projection or guess been made based on the available data?
3. Can you spot a sentence that summarizes the data or draws a conclusion based on it?
4. Has the analysis been supported with figures from the given data?
5. Is there any unnecessary repetition?
6. How many times has the verb 'be' in its different forms been used? Some useful expressions :
|
{much ,many, far ,slightly, a little} |
more, greater,higher, less, lower, further, farther |
|
{half, twice, ten times, (etc.)} |
as { adj. adv.} as |
|
10 percent 150 percent |
{more less } than |
| almost the same ____ as | |
| as {adj adv.} as |
Solution
After the discussion with the partner, the results are given below :
1. The expressions for comparing the data have been underlined :
As whalers reduced catches of the larger whales, they switched to smaller species. This is evident when we compare figures for the Antarctic catch of the larger sei whale with those for small minke whale. In 1985, fifteen times as many sei whales as minke whales were caught. By 1995, catches of both the species were virtually the same (9000). By the 2000, the situation had reversed and the number of minke whales killed was more than doubledas compared to sei whales (6000). The graph shows that while the sei catch bwas reduced by 95% between 1985 and 2010, over the same period the minke whale catch was eight times greater. If these trends continue, the situation for the smaller species will be as bad as it used to be for the larger ones.
2. The main trends refer to the comparison of the trends in the two activities.
3. The conclusion emphasizes that if these trends continue, the situation for the smaller species will be as bad as it used to be for the larger ones.
4. The analysis is supported with the comparison of the situation between the years 1985 and 2010.
5. Not exactly ; there is hardly any repetition.
6. The use of verb ‘be’ in its different forms has been identified ie, they figure six times in the given passage which are given as under :
- is evident
- were caught
- were virtually
- had reversed
- was reduced
- was 8 times greater
APPEARS IN
RELATED QUESTIONS
Information Transfer Non-Verbal to Verbal :
Observe the following web-chart carefully and write two short paragraphs of ‘Advantages of watching Television’ with the help of the points given.
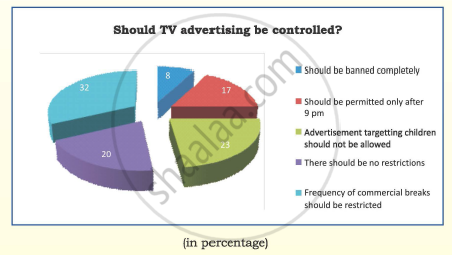
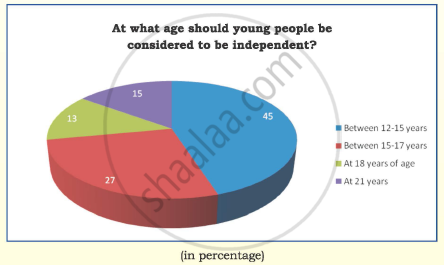
A school carried out two surveys in Class X. Look at the pie charts below and write short summaries of the results as in the model above.

____________________________________________________________________
____________________________________________________________________
____________________________________________________________________

____________________________________________________________________
____________________________________________________________________
____________________________________________________________________
Read the following information and prepare a pie diagram for the same.
Annual Water Usage in Maharashtra
Water is life. It is a universal solvent and an important resource. The annual usage of water differs in various sectors of Maharashtra. The major occupation of Maharashtra being agriculture, the maximum amount of available water is used for irrigation that is 86%. The distant following place 7% is contributed by domestic sector including drinking, washing, cooking, etc. There is a close competition of other sectors which is not far away with 6% usage of water. One of the key factors which plays an important role in the development of a nation is industrial sector. The consumption of water by industrial sector is very negligible which is 1%. We know energy sector plays a vital role in the development of a nation.
In this sector, the use of water is almost nil. If we try to observe its place in the chart we do realise that it holds 0% usage and is yet to open its account.
Observe the following table and transfer the information into a paragraph:
Statewise Distribution of Urban and Rural Population in India:
| States | Population in Millions | |
| Rural | Urban | |
| Maharashtra | 560 | 410 |
| Gujarat | 320 | 190 |
| Madhya Pradesh | 440 | 160 |
| Chhattisgarh | 170 | 40 |
| Andhra Pradesh | 550 | 210 |
| Karnataka | 350 | 180 |
Read the following passage and complete the table
Dialect is a form of a language spoken in one area which may be different from other forms of the same language. Each language has dialects which change every few kilometers. India is a multi-lingual country. Each state follows its own language as official language. For example, Marathi is the official language of Maharashtra, while Ahirani, Wharadi, Konkani and Malwani are its dialects. Several languages in India are spoken but do not have any script. In Karnataka, Kannada is the official language. Tulu is spoken in Karnataka but has no script. In England, English is the official language while Scottish, spoken in Scotland and Welsh spoken in Wales are dialects of English.
| State | Official language | Dialects | Spoken/ Without script |
| Maharashtra | Marathi | ||
| Karnataka | |||
| England |
Transfer the information into a paragraph about ‘Average Annual Tea Consumption Per Person’ as shown in the table given below :
| Nation | Turkey | Ireland | United Kingdom | Russia | Morocco | China | India |
| Tea consumption per person ( in Kg) | 3.15 | 2.19 | 1.94 | 1.38 | 1.21 | 0.57 | 0.32 |
Observe the following web diagram carefully and convert it into a paragraph.

Non-verbal to Verbal:
Transfer the information into a paragraph:
Observe the tree diagram of types of disease and write a paragraph on it. Suggest a suitable title.

Verbal to Non-verbal:
Read the following statements and prepare a chart of 'Dos' and 'Don'ts'. Suggest a suitable title for it.
Nature is abode for all of us. lt provides us with all our basic needs. However, we must take care of the following things so that our mother nature is not harmed.
- We must plant more trees.
- We should not cut trees.
- We must keep our area neat and clean.
- We should never discharge garbage without proper management.
- We should not pollute air and water.
- We should not use plastic bags.
- We should not hunt birds or animals.
- We should use more of public transport.
- We should spread awareness about the importance of maintaining balance in nature.
A survey was conducted in the National Capital in over twenty schools about 40 different activities that interest the children in the age group of 13 years to 15 years. Write a paragraph in not more than 120 words, analyzing the following information.

