Advertisements
Advertisements
Question
Observe the given figure and answer the following questions.
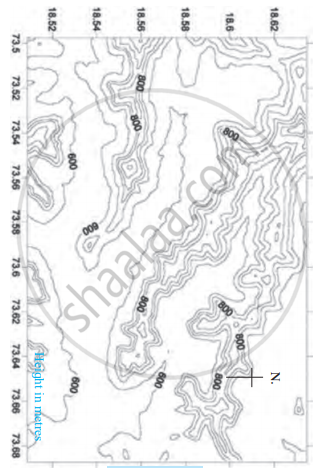
- What is the general direction of the ranges shown in the map?
- Towards which direction is the flat land located in the map?
- What are the maximum and minimum values of the lines in the map?
- What do these values indicate?
- Do you find any similarities in the map and the model in Figure? What are those?
- Which figure gives us more information and what is that information?
- Is there any similarity between this map and the sketch map of the potato hill?
- What all do you see in the map?
Short Note
Solution
- The general direction of the ranges shown in the map is east-west.
- The flat land is located towards the south in the map.
- The maximum and minimum values of the lines in the map are 600 metres and 800 meters respectively.
- These values indicate the altitude of different places from the sea level.
- We find similarities in the map and the model in Figure. The landforms that are shown by different colours in a model are shown by contour lines in the contour line map.
- Figure (b) (contour line map) gives us more information than Figure (a) (A model of the earth's surface.) Contour line maps gives additional information of altitude of a particular place from sea level, the nature of slope and direction of the slope of a particular place.
- There are many similarities between this map and the sketch map of the potato hill.
- We can see the following things in the map : (i) Altitude of landforms
(ii) Slopes of landforms
(iii) Direction of slopes of landforms
(iv) The spread of a particular landform in a particular region.
shaalaa.com
Contour Maps and Landforms
Is there an error in this question or solution?
APPEARS IN
RELATED QUESTIONS
How can the distribution of the height and landforms in a region be shown?
To whom are the contour maps useful?
What do you understand by observing contour lines?
How will a contour map be useful for a farmer?
If the contour lines are closer to each other, the slope is ______.
The contour lines on the map represent ______.
The slope can be understood from the distance between the ______.
If the distance between two contour lines is more, the ______ is gentle.
Identify the landforms in the following map.

Observe this model and the map figure a and b given below it and answer the following questions.

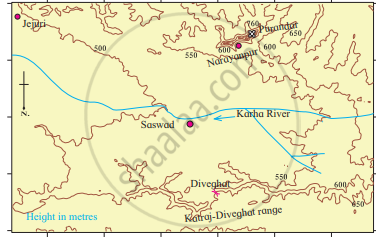
- In which direction does fort Purandar lie?
- What is the direction of the flow of the river Karha?
- In which parts are the hill ranges not observed?
- Which part of the map is not seen in the model? Why?
- In which direction does the altitude of the Katraj-Diveghat range decrease?
- In which direction are higher hill ranges located?
