Advertisements
Advertisements
Question
Observe the market supply schedule of potatoes and answer the following question:
| Price in ₹ | Firms | Market supply (kg) | ||
| A | B | C | ||
| 1 | ____ | 20 | 45 | 100 |
| 2 | 37 | 30 | 45 | _____ |
| 3 | 40 | ____ | 55 | 155 |
| 4 | 44 | 50 | _____ | 154 |
- Complete the quantity of potatoes supplied by the firms to the market in the above table.
- Draw the market supply curve from the schedule and explain it.
Solution
Price in ₹ Firms Market supply (kg) A B C 1 35 20 45 100 2 37 30 45 112 3 40 60 55 155 4 44 50 60 154 
In the diagram, the quantity supplied is shown on the X-axis and the price on the Y-axis.
A. Supply curve SS slopes upward from left to right indicating a direct relationship between price and market supply.
B. It is pertinent to note that when the price rises from price 3 to price 4, the supply more or less remains the same at 155 quantity supply.
C. This shows that agricultural goods are an exception to the law of supply. Their supply is inelastic in the short term.
APPEARS IN
RELATED QUESTIONS
Distinguish between:
Stock and Supply
When the supply curve is upward-sloping, its slope is ______.
Complete the Correlation:
Demand curve : _______ :: Supply curve : Upward
______ : Change in supply : : Other factors constant : Variation of supply
Observe the following table and answer the question:
Supply schedule of chocolates
| Price in ₹ | Quantity supplied in units |
| 10 | 200 |
| 15 | _____ |
| 300 | |
| 25 | 350 |
| 30 | _____ |
| 35 | _____ |
| 40 | _____ |
State the relationship between price and quantity supplied.
Identify and explain the following concept.
Out of 4000 kgs of rice, the farmer offered to sale 1000 kgs of rice in the market for ₹ 40 per kg.
Assertion (A): Supply is a relative term.
Reasoning (R): Supply is always expressed in relation to price, time and quantity.
Find the odd word out:
Factors leading to increase in supply:
Identify and explain the concept from the given illustration:
Out of 100 kgs of apples, Vasantrao offered to sell 90 kgs of apples in the market at ₹ 100 per kg.
Find the odd word out:
Factors leading to decrease in supply:
Study the following diagram and answer the questions:
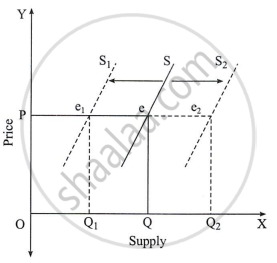
Questions:
- The diagram shows the `square` relationship between price and supply.
- The supply curve 'S' has a `square` slope.
- In a decrease in supply, the equilibrium point shifts from 'e' to `square`.
- In an increase in supply, the equilibrium point shifts from 'e ' to `square`.
Find the odd word out:
Factors leading to increase in supply:
Read the following passage and answer the questions:
| Railways are the principal mode of transportation for freight and passengers in India. Railways also make it possible to conduct many activities like business, sightseeing and pilgrimage along with the transportation of goods over longer distances. The Northern Plains with their vast fertile level land have helped in the development of agricultural activities in Northern India. The Indian railways have helped in the movement of agricultural goods from Northern India to various parts of the country. Konkan Railway along the west coast of India connects the states of Maharashtra, Goa and Karnataka. Konkan railway has helped in supplying fruits, fruit pulps, condiments, steel, minerals like bauxite, glassware, leather goods, etc. |
Questions:
- Explain the factors affecting the supply of agricultural goods.
- Name the agricultural and non-agricultural products supplied by Konkan Railway.
Identify and explain the concept from the given illustration:
A farmer offered to sale 25 kgs of watermelon in the local market per day at ₹50 per kg.
A rightward shift in supply curve shows ______.
A rightward shift in supply curve shows ______.
