Advertisements
Advertisements
Question
Observe this bar graph which is showing the sale of shirts in a ready-made shop from Monday to Saturday.

Now answer the following questions:
- What information does the above bar graph give?
- What is the scale chosen on the horizontal line representing number of shirts?
- On which day were the maximum number of shirts sold? How many shirts were sold on that day?
- On which day were the minimum number of shirts sold?
- How many shirts were sold on Thursday?
Answer in Brief
Solution
- The above bar graph shows the number of shirts sold from Monday to Saturday.
- 1 unit length = 5 shirts is the scale on the horizontal line representing the number of shirts.
- On Saturday the maximum number of shirts sold i.e 60 shirts were sold.
- On Tuesday the minimum number of shirts sold i.e 10 shirts were sold.
- 35 shirts were sold on Thursday.
shaalaa.com
Is there an error in this question or solution?
APPEARS IN
RELATED QUESTIONS
The following table shows the market positions of some brands of soap.
Draw a suitable bar graph:
| Soap (brands): | A | B | C | D | E |
| No. of buyers: | 51 | 27 | 15 | 24 | 18 |
The birth rate per thousand of different countries over a particular period of time is shown below.
| INDIA | U.K. | CHINA | GERMANY | SWEDEN |
| 35 | 22 | 43 | 13 | 8 |
The spaces between any two bars in a bar graph _____________
The bar graph given alongside shows the amount of wheat purchased by the government during the year 1998-2002.
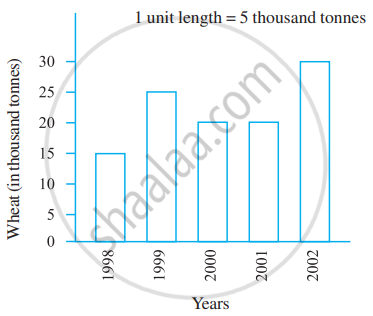
Read the bar graph and write down your observations.
- In which year was the wheat production maximum?
- In which year was the wheat production minimum?
Observe this bar graph which shows the marks obtained by Aziz in half-yearly examinations in different subjects. 
Answer the given questions.
- What information does the bar graph give?
- Name the subject in which Aziz scored maximum marks.
- Name the subject in which he has scored minimum marks.
- State the name of the subjects and marks obtained in each of them.
