Advertisements
Advertisements
Question
Observe this bar graph which shows the marks obtained by Aziz in half-yearly examinations in different subjects. 
Answer the given questions.
- What information does the bar graph give?
- Name the subject in which Aziz scored maximum marks.
- Name the subject in which he has scored minimum marks.
- State the name of the subjects and marks obtained in each of them.
Answer in Brief
Solution
- The bar graph shows the marks scored by Aziz in different subjects.
- Aziz scored maximum marks in Hindi, i.e., 80 marks.
- Aziz scored minimum marks in Social Studies, i.e., 40 marks.
- Hindi – 80 marks English – 60 marks Mathematics – 70 marks Science – 50 marks Social Studies – 40 marks.
shaalaa.com
Is there an error in this question or solution?
APPEARS IN
RELATED QUESTIONS
The following table shows the market positions of some brands of soap.
Draw a suitable bar graph:
| Soap (brands): | A | B | C | D | E |
| No. of buyers: | 51 | 27 | 15 | 24 | 18 |
The birth rate per thousand of different countries over a particular period of time is shown below.
| INDIA | U.K. | CHINA | GERMANY | SWEDEN |
| 35 | 22 | 43 | 13 | 8 |
The spaces between any two bars in a bar graph _____________
The bar graph given alongside shows the amount of wheat purchased by the government during the year 1998-2002.
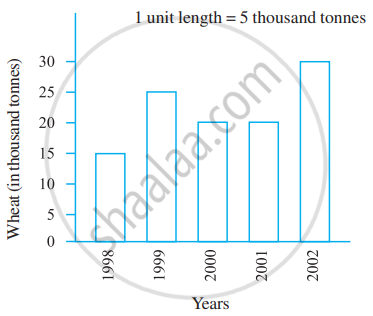
Read the bar graph and write down your observations.
- In which year was the wheat production maximum?
- In which year was the wheat production minimum?
Observe this bar graph which is showing the sale of shirts in a ready-made shop from Monday to Saturday.

Now answer the following questions:
- What information does the above bar graph give?
- What is the scale chosen on the horizontal line representing number of shirts?
- On which day were the maximum number of shirts sold? How many shirts were sold on that day?
- On which day were the minimum number of shirts sold?
- How many shirts were sold on Thursday?
