Advertisements
Advertisements
Question
Solution
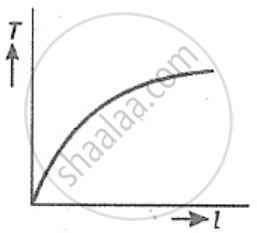
Graph of T versus l for a simple pendulum

APPEARS IN
RELATED QUESTIONS
Name two factors on which the time period of a simple pendulum does not depend.
A pupil determines the velocity of sound as 320 ms−1. If the actual velocity of sound is 332 ms−1, calculate the percentage error.
A second’s pendulum is taken on the surface of the moon where the acceleration due to gravity is l/6th of that of earth. Will the time period of pendulum remain the same or increase or decrease? Give a reason.
What do you understand by the term graph?
State the two ratios of a scale, which are suitable for plotting points.
State three important precautions which must be followed while plotting points on a graph.
State two important precautions for drawing a graph line.
What do you understand by the term constant of proportionality?
