Advertisements
Advertisements
Question
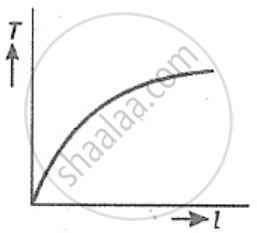
Plot a graph between the time period (T) and length (l) for a simple pendulum.
Graph
Solution
Graph of T versus l for a simple pendulum

shaalaa.com
Simple Pendulum for Time
Is there an error in this question or solution?
APPEARS IN
RELATED QUESTIONS
The time period of a simple pendulum is 2 s. What is its frequency? What name is given to such a pendulum?
Length of the second’s pendulum is 100 cm. Find the length of another pendulum whose time period is 2.4 s.
The time periods of two pendulums are 1.44 s and 0.36 s respectively. Calculate the ratio of their lengths.
The time period of the two pendulums are 2 s and 3 s respectively. Find the ratio of their lengths.
How does a graph help in determining the proportional relationship between the two quantities?
Which of the following is not a unit of distance?
Complete the rollowing:
1 light year= ________ m
Compare the time periods of a simple pendulum at places where g = 9.8 ms−2 and 4.36 ms−2 respectively.
Plot a graph between square of the time period (T2) and length (l) for a simple pendulum.
What is the relation between frequency (f) and time period (T)?
