Advertisements
Advertisements
Question
How does a graph help in determining the proportional relationship between the two quantities?
Solution
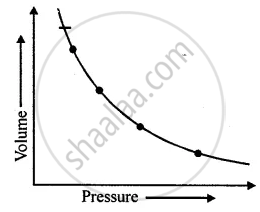
It has been found that if a graph is plotted between the pressure of an enclosed gas at a constant temperature, against its volume, the graph line is a smooth curve, which does not meet X-axis or Y-axis on extending as shown in the figure.
From the figure, it is clear that the pressure of a gas is not directly proportional to the volume of gas.
However, if a graph is plotted between pressure and the inverse of volume, the graph line is a straight line as illustrated in the figure. From the straight-line graph we can say:
The pressure is inversely proportional to volume.
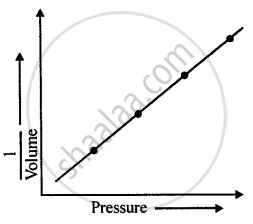
Thus, P α `1/"V"`
Similarly, if a graph is plotted between length and time period of a simple pendulum, the graph line is a curve, which has a tendency to meet X-axis or Y-axis when produced towards the origin, as shown in the figure.
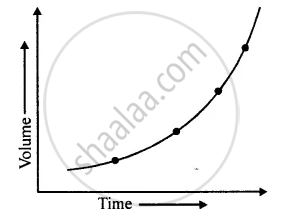
From the figure, it is clear that the length of a simple pendulum is not proportional to its time period.
However, if a graph is plotted between length and (Time)2, the graph line is a straight line. Thus, we can say:
From the above discussion, it is very clear that the graph line helps to determine the nature of proportional relationship between two variable quantities.
APPEARS IN
RELATED QUESTIONS
What is a simple pendulum? Is the pendulum used in a pendulum clock simple pendulum? Give reason to your answer.
Find the length of a second's pendulum at a place where g = 10 m s-2 (Take π = 3.14)
Compare the time periods of the two pendulums of lengths 1 m and 9 m.
How much time does the bob of a second's pendulum take to move from one extreme of its oscillation to the other extreme?
Amongst the independent variable and dependent variable, which is plotted on X-axis?
State two important precautions for drawing a graph line.
Complete the rollowing:
1 light year= ________ m
Define the following terms with reference to a simple pendulum:
Time period
