Advertisements
Advertisements
Question
Plot the following points on a graph sheet. Verify if they lie on a line
K(2, 3), L(5, 3), M(5, 5), N(2, 5)
Solution
We can plot the given points and join the consecutive points on a graph paper as follows.

Hence, points K, L, M, and N are not lying on the same line.
APPEARS IN
RELATED QUESTIONS
A point which lies on both the axis is ______.
A point has 5 as its x–coordinate and 4 as its y–coordinate. Then the coordinates of the point are given by ______.
The point where the two axes intersect is called the ______.
The distance of any point from the x-axis is called the x-coordinate.
The ordinate of a point is its distance from the y-axis.
The graph given below compares the sales of ice creams of two vendors for a week.

Observe the graph and answer the following questions.
- Which vendor has sold more icecreams on Friday?
- For which day was the sales same for both the vendors?
- On which day did the sale of vendor A increase the most as compared to the previous day?
- On which day was the difference in sales the maximum?
- On which two days was the sales same for vendor B?
The table given below shows the temperatures recorded on a day at different times.
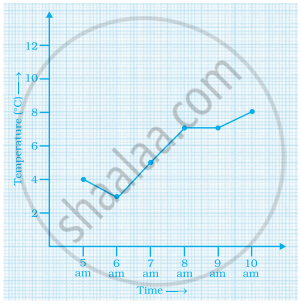
Observe the table and answer the following questions.
- What is the temperature at 8 am?
- At what time is the temperature 3°C?
- During which hour did the temperature fall?
- What is the change in temperature between 7 am and 10 am?
- During which hour was there a constant temperature?
The following table gives the growth chart of a child.
| Height (in cm) | 75 | 90 | 110 | 120 | 130 |
| Age (in years) | 2 | 4 | 6 | 8 | 10 |
Draw a line graph for the table and answer the questions that follow.
- What is the height at the age of 5 years?
- How much taller was the child at the age of 10 than at the age of 6?
- Between which two consecutive periods did the child grow more faster?
Consider this input/output table.
| Input | 1 | 2 | 4 | 5 | 7 |
| Output | 2 | 5 | 11 | 14 | 20 |
- Graph the values from the table by taking Input along horizontal axis from 0 to 8 and Output along vertical axis from 0 to 24.
- Use your graph to predict the outputs for inputs of 3 and 8.
The graph given below compares the price (in Rs) and weight of 6 bags (in kg) of sugar of different brands A, B, C, D, E, F.
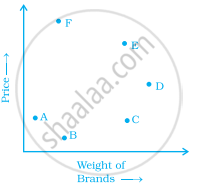
- Which brand(s) costs/cost more than Brand D?
- Bag of which brand of sugar is the heaviest?
- Which brands weigh the same?
- Which brands are heavier than brand B?
- Which bag is the lightest?
- Which bags are of the same price?
