Advertisements
Advertisements
Question
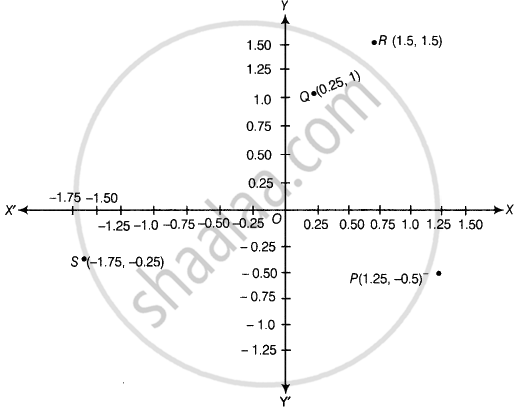
Plot the points (x, y) given by the following table. Use scale 1 cm = 0.25 units
| x | 1.25 | 0.25 | 1.5 | – 1.75 |
| y | – 0.5 | 1 | 1.5 | – 0.25 |
Solution
Let X’OX and Y’OX be the coordinate axes. Plot the given points (1.25, – 0.5), (0.25, 1), (1.5, 1.5) and (– 1.75, – 0.25) on the graph paper.
APPEARS IN
RELATED QUESTIONS
Plot the following point on the graph paper:
(4, −3)
Plot the following point on the graph paper:
(7, −4)
Some points are shown in the following figure. With the help of it answer the following questions:
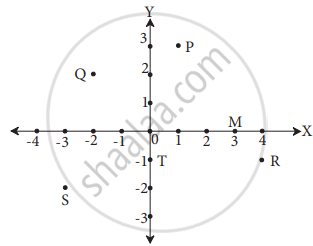
- Write the co-ordinates of the points Q and R.
- Write the co-ordinates of the points T and M.
- Which point lies in the third quadrant?
- Which are the points whose x and y co-ordinates are equal?
Plot the following point in the coordinate system and identify the quadrant.
S(3, 5)
Plot the following point in a graph sheet.
A(5, 2)
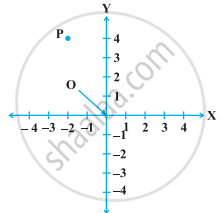
In the following figure, coordinates of P are ______.
Plot the following points and check whether they are collinear or not:
(1, 1), (2, – 3), (– 1, – 2)
Points A(5, 3), B(– 2, 3) and D(5, – 4) are three vertices of a square ABCD. Plot these points on a graph paper and hence find the coordinates of the vertex C.
Plot the points P(1, 0), Q(4, 0) and S(1, 3). Find the coordinates of the point R such that PQRS is a square.
Plot the points A(1, – 1) and B(4, 5). Draw a line segment joining these points. Write the coordinates of a point on this line segment between the points A and B.
