Advertisements
Advertisements
Question
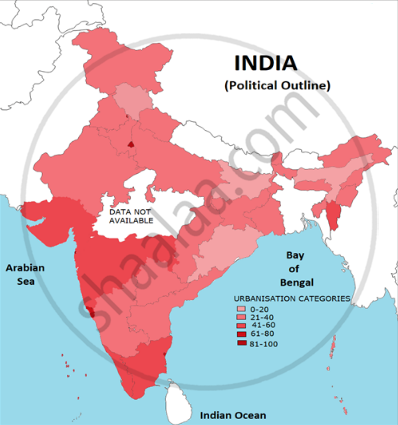
Prepare a choropleth map showing the urban population using the data given in the table below.
| S.NO | Urban population percentage category | States /UTs falling in the category |
| 1. | 0-20 | Himachal Pradesh, Bihar, Assam, Odisha |
| 2. | 21-40 | Meghalaya, Uttar Pradesh, Arunachal Pradesh, Chhattisgarh, Jharkhand, Rajasthan, Sikkim, Tripura, Jammu & Kashmir, Nagaland, Manipur, Uttarakhand, West Bengal, Andhra Pradesh, Haryana, A & N Islands, Punjab, Karnataka |
| 3. | 41-60 | Gujarat, Maharashtra, Dadra & Nagar Haveli, Kerala, Tamil Nadu, Mizoram |
| 4. | 61-80 | Goa, Puducherry, Daman & Diu, Lakshadweep |
| 5. | 81-100 | Chandigarh, NCT of Delhi |
Solution
RELATED QUESTIONS
Prepare a multiple bar graph on the basis of the given information and answer the questions.
India and Brazil – Urban population (%)
| Country/ year | 2015 | 2016 | 2017 |
| India | 32.1 | 32.5 | 32.8 |
| Brazil | 84.7 | 84.9 | 85.1 |
1) What is the percentage of urban population in India in 2017?
2) In which country is the percentage of urban population higher?
3) What does the trend in urban population in both the countries indicate?
Concentrated settlements are found in Narmada Valley because of ______
Give a geographical reason.
Urbanization is increasing rapidly in India.
Give geographical reason.
Except Delhi and Chandigarh, urbanization is low in other parts of India.
State whether right or wrong.
Development of roads is one of the development index of a country.
Write a short note.
Comparison of urbanisation in Brazil and India
Prepare a line graph with the help of given statistical information and answer the questions given below-
India-trends of urbanization(%)
| Year | India |
| 1961 | 18.0 |
| 1971 | 18.2 |
| 1981 | 23.3 |
| 1991 | 25.7 |
| 2001 | 27.8 |
| 2011 | 31.2 |
Questions-
- In which year 18% urbanization is found?
- Urbanization has increased by how many percent from 2001 to 2011?
- In which decade was the growth of urbanization highest?
Find the correct pair.
Indian states with less than 61% to 80% urbanisation.
With the help of given statistical data showing the percentages of urbanisation in India and Brazil for three decades, prepare a simple bar graph and answer the following questions :
| Year | 1990 | 2000 | 2010 |
| Brazil | 74.6 | 81.5 | 84.6 |
| India | 25.7 | 27.8 | 31.2 |
- In which decade the trend of urbanization was higher in Brazil?
- In which decade does the urbanization in India appear to be rapid?
- Compare the differences in the percentages of urbanization in both countries. In which decade is the difference in the percentage of urbanization the highest?
Mark the following in the outline map of India. Write the names and give index:
- Union territory - Daman
- Heavy rainfall region to the west coast
- Cold desert
- Region to the north having high density of population
- Kanyakumari
- Chilka lake
