Advertisements
Advertisements
Question
Read the bar graph given in Fig. 23.19 and answer the following questions:
(i) What information is given by the bar graph?
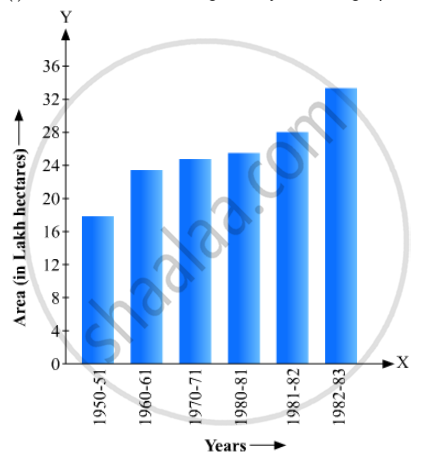
(ii) In which years the areas under the sugarcane crop were the maximum and the minimum?
(iii) State whether true or false:
The area under the sugarcane crop in the year 1982 - 83 is three times that of the year 1950 - 51
Solution
i) It gives the information about the areas under sugarcane crop during different years in India
(ii) The areas under the sugarcane crop were the maximum and the minimum in 1982-1983 and 1950- 51 respectively
(iii) The area under sugarcane crop in the year1982-1983 =34 lakh hectors.
The area under sugarcane crop in the year 1950- 51 = 17lakh hectors
Clearly, the area under the sugarcane crop in the year 1982- 83 is not three tomes that of the year 1950-51
So, the given statement is false
APPEARS IN
RELATED QUESTIONS
The runs scored by two teams A and B on the first 60 balls in a cricket match are given below:
| Number of balls | Team A | Team B |
| 1 - 6 | 2 | 5 |
| 7 - 12 | 1 | 6 |
| 13 - 18 | 8 | 2 |
| 19 - 24 | 9 | 10 |
| 25 - 30 | 4 | 5 |
| 31 - 36 | 5 | 6 |
| 37 - 42 | 6 | 3 |
| 43 - 48 | 10 | 4 |
| 49 - 54 | 6 | 8 |
| 55 - 60 | 2 | 10 |
Represent the data of both the teams on the same graph by frequency polygons.
[Hint: First make the class intervals continuous.]
Read the following bar graph and answer the following questions:

(i) What information is given by the bar graph?
(ii) Which state is the largest producer of rice?
(iii) Which state is the largest producer of wheat?
(iv) Which state has total production of rice and wheat as its maximum?
(v) Which state has the total production of wheat and rice minimum?
Read the bar graph given in Fig. 23.17 and answer the following questions:
(i) What information is given by the bar graph?
(ii) What was the crop-production of rice in 1970 - 71?
(iii) What is the difference between the maximum and minimum production of rice?

The following table shows the number of Maruti cars sold by five dealers in a particular month:
| Dealer: | Saya | Bagga Links | D.D. Motors | Bhasin Motors | Competent |
| Cars sold: | 60 | 40 | 20 | 15 | 10 |
Represent the above information by a pictograph.
Construct a frequency polygon for the following data:
| Class-Intervals | 10 - 14 | 15 - 19 | 20 - 24 | 25 - 29 | 30 - 34 |
| Frequency | 5 | 8 | 12 | 9 | 4 |
A hundred students from a certain locality use different modes of travelling to school as given below. Draw a bar graph.
| Bus | Car | Rickshaw | Bicycle | Walk |
| 32 | 16 | 24 | 20 | 8 |
The following tables show the mode of transport used by boys and girls for going to the same school.
| Bus | Bicycle | Walking | Other sources | |
|
Number of boys |
80 | 60 | 20 | 85 |
|
Number of girls |
90 | 75 | 35 | 60 |
Draw a double bar graph representing the above data.
Mr. Mirza’s monthly income is Rs. 7,200. He spends Rs. 1,800 on rent, Rs. 2,700 on food, Rs. 900 on the education of his children; Rs. 1,200 on Other things and saves the rest.
Draw a pie-chart to represent it.
Expenditure on Education of a country during a five year period (2002-2006), in crores of rupees, is given below:
| Elementary education | 240 |
| Secondary Education | 120 |
| University Education | 190 |
| Teacher’s Training | 20 |
| Social Education | 10 |
| Other Educational Programmes | 115 |
| Cultural programmes | 25 |
| Technical Education | 125 |
Represent the information above by a bar graph.
The following table gives the frequencies of most commonly used letters a, e, i, o, r, t, u from a page of a book:
| Letters | a | e | i | o | r | t | u |
| Frequency | 75 | 125 | 80 | 70 | 80 | 95 | 75 |
Represent the information above by a bar graph.
