Advertisements
Advertisements
Question
Read the following graph and answer the questions given below:
Questions:
- What is shown in the above graph?
- Which decade has maximum percentages of cultivators?
- Which decade has minimum percentages of agricultural labourers?
- In present graph, which factor have maximum percentages in every decade?
- In 1971 what is the percentage of cultivators and agricultural labours?
Short Answer
Solution
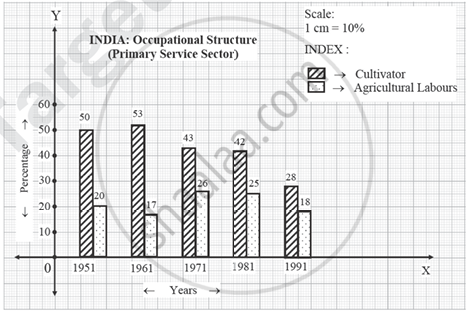
- The graph represents the occupational structure in India's primary service sector, showing the percentage of cultivators and agricultural labourers from 1951 to 1991.
- The decade 1961 has the highest percentage of cultivators (53%).
- The decade 1961 had the lowest percentage of agricultural labourers (17%).
- Cultivators have the highest percentage in every decade.
- In 1971, the percentage of cultivators was 43%, and the percentage of agricultural labourers was 26%.
shaalaa.com
Is there an error in this question or solution?
