Advertisements
Advertisements
Question
Study the flow chart given below and complete the equation that follows by identifying 1, 2, 3 and 4.
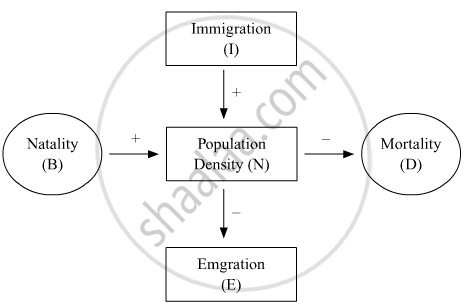
Nt + 1 = Nt + {(1+ 2) − (3 + 4)}
Solution
Nt + 1 = Nt + {(B+ I) − (D + E)}
APPEARS IN
RELATED QUESTIONS
(a) Name the two growth models that represent population growth and draw the respective growth curves they represent.
(b) State the basics for the difference in the shape of these curves
(c) Which one of the curves represents the human population growth at present? Do you think such a curve is sustainable? Give reason in support of your answer.
Study the graph given below and answer the questions that follow :
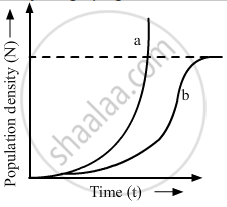
(i) Write the status of food and space in the curves (a) and (b).
(ii) In the absence of predators, which one of the two curves would appropriately depict the prey population?
(iii) Time has been shown on X-axis and there is a parallel dotted line above it. Give the significance of this dotted line
How does an age pyramid for human population at given point of time helps the policy-makers in planning for future.
List the attributes that populations but not individuals possess.
Population having large number of postreproductive and small number of prereproductive age group is called
Age distribution in a population can influence
The density of a population in a habitat per unit area is measured in different units. Write the unit of measurement against the following:
Banyan
An individual and a population has certain characteristics. Name these attributes with definitions.
Given below is the Age Pyramid of the population in one of the states in India as per 2011 census. It depicts the male population on the left-hand side, female population on the right-hand side, newborns towards the base and gradually increasing age groups as we move from base to the top, with the oldest population at the top. Study this pyramid and comment upon the appropriateness of the Assertion and the Reason.
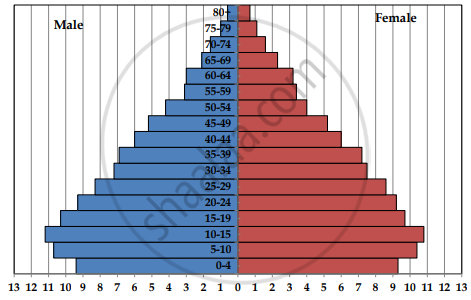
Percentage to the total population
Assertion: It is a stable population.
Reason: The pre-reproductive and reproductive individuals are almost in equal numbers and the post-reproductive individuals are relatively fewer.
With the help of neatly labelled diagrams, explain the different types of age pyramids of human population.
