Advertisements
Advertisements
Question
Given below (Fig. below) is the bar graph indicating the marks obtained out of 50 in mathematics paper by 100 students. Read the bar graph and answer the following questions:

(i) It is decided to distribute work books on mathematics to the students obtaining less than 20 marks, giving one workbook to each of such students. If a work book
costs Rs 5, what sum is required to buy the work books?
(ii) Every student belonging to the highest mark group is entitled to get a prize of Rs. 10. How much amount of money is required for distributing the prize money?
(iii) Every student belonging to the lowest mark—group has to solve 5 problems per day. How many problems, in all, will be solved by the students of this group per day?
(iv) State whether true or false.
a. 17% students have obtained marks ranging from 40 to 49.
b. 59 students have obtained marks ranging from 10 to 29.
(v) What is the number of students getting less than 20 marks?
(vi) What is the number of students getting more than 29 marks?
(vii) What is the number of students getting marks between 9 and 40?
(viii) What is the number of students belonging to the highest mark group?
(ix) What is the number of students obtaining more than 19 marks?
Solution
(i) Total number of students obtaining less than 20 marks = 27 + 12 = 39.
The cost off one – work book = Rs 5.
∴ The cost of 30 work books 39 × 5
= Rs 195.
(ii) The number of students belonging to the highest mark group = 17
The cost of a prize = 10.
∴ The cost of 17 prizes =10×17
=Rs 170
(iii) The number of students belonging to the lowest mark group =27
∴ The number of problems solved by 1 student = 5
The total number of problems solved by 27 students 5 × 27
=135.
(iv) (a) Total number of students = 100
The number of students in range 40-49=17.
%of students obtaining marks ranging
40 - 49 = `17/100`×100
=17%
So, the given statement is true.
(b) The number of students in range 10-29 =12 =120 = 32.
Percentage of students obtaining marks ranging
10 - 29 = `32/100× 100 = 32%`
So, the given statement is false (False).
(v) No. of students getting more than 20 marks = 39
(vi) Total no. of students getting more than 29 marks = 41
(vii) The number of students getting marks between 9 and 40 =12+20+24 = 56.
(viii) The number of students belonging to the highest mark group = 17.
(ix) The number of students obtaining more than 19 marks =100-27-12 = 61
APPEARS IN
RELATED QUESTIONS
A survey conducted by an organisation for the cause of illness and death among the women between the ages 15 - 44 (in years) worldwide, found the following figures (in %):-
| S.No. | Causes | Female fatality rate (%) |
| 1. | Reproductive health conditions | 31.8 |
| 2. | Neuropsychiatric conditions | 25.4 |
| 3. | Injuries | 12.4 |
| 4. | Cardiovascular conditions | 4.3 |
| 5. | Respiratory conditions | 4.1 |
| 6. | Other causes | 22.0 |
- Represent the information given above graphically.
- Which condition is the major cause of women’s ill health and death worldwide?
- Try to find out, with the help of your teacher, any two factors which play a major role in the cause in (ii) above being the major cause.
A random survey of the number of children of various age groups playing in a park was found as follows:
| Age (in years) | Number of children |
| 1 - 2 | 5 |
| 2 - 3 | 3 |
| 3 - 5 | 6 |
| 5 - 7 | 12 |
| 7 - 10 | 9 |
| 10 - 15 | 10 |
| 15 - 17 | 4 |
Draw a histogram to represent the data above.
Study the bar graph representing the number of persons in various age groups in a town shown in Fig. below. Observe the bar graph and answer the following questions:
(i) What is the percentage of the youngest age-group persons over those in the oldest age group?
(ii) What is the total population of the town?
(iii) What is the number of persons in the age group 60 - 65?
(iv) How many persons are more in the age-group 10 - 15 than in the age group 30 - 35?
(v) What is the age-group of exactly 1200 persons living in the town?
(vi) What is the total number of persons living in the town in the age-group 50 - 55?
(vii) What is the total number of persons living in the town in the age-groups 10 - 15 and 60 - 65?
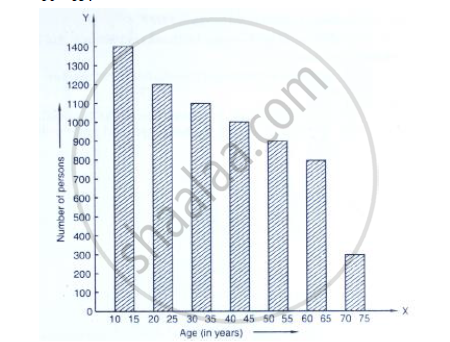
(viii) Whether the population in general increases, decreases or remains constant with the increase in the age-group.
Read the bar graph shown in Fig. 23.10 and answer the following questions
(i) What is the information given by the bar graph?
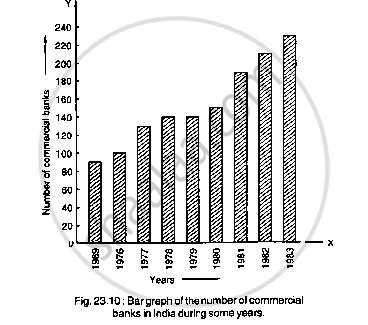
(ii) What was the number of commercial banks in 1977?
(iii) What is the ratio of the number of commercial banks in 1969 to that in 1980?
(iv) State whether true or false:
The number of commercial banks in 1983 is less than double the number of commercial banks in 1969.
The bar graph shown in Fig 23.16 represents the circulation of newspapers in 10 languages. Study the bar graph and answer the following questions:

(i) What is the total number of newspapers published in Hindi, English, Urdu, Punjabi and Bengali?
(ii) What percent is the number of news papers published in Hindi of the total number of newspapers?
(iii) Find the excess of the number of newspapers published in English over those published in Urdu.
(iv) Name two pairs of languages which publish the same number of newspapers.
(v) State the language in which the smallest number of newspapers are published.
(vi) State the language in which the largest number of newspapers are published.
(vii) State the language in which the number of newspapers published is between 2500 and 3500.
(viii) State whether true or false:
a. The number of newspapers published in Malayalam and Marathi together is less than those published in English.
b. The number of newspapers published in Telugu is more than those published in Tamil.
Read the bar graph given in Fig. below and answer the following questions:
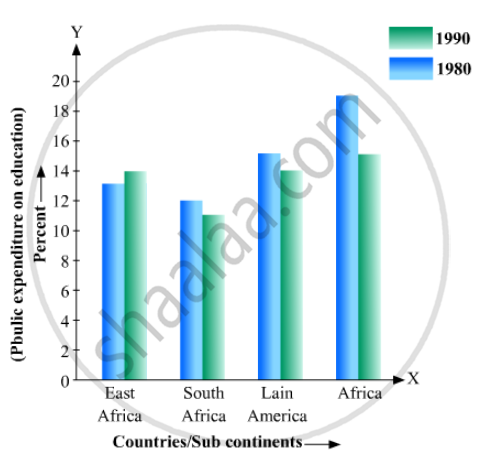
(i) What information does it give?
(ii) In which part the expenditure on education is maximum in 1980?
(iii) In which part the expenditure has gone up from 1980 to 1990?
(iv) In which part the gap between 1980 and 1990 is maximum?
In a histogram, each class rectangle is constructed with base as
Construct a combined histogram and frequency polygon for the following frequency distribution:
| Class-Intervals | 10 - 20 | 20 - 30 | 30 - 40 | 40 - 50 | 50 - 60 |
| Frequency | 3 | 5 | 6 | 4 | 2 |
Mr. Mirza’s monthly income is Rs. 7,200. He spends Rs. 1,800 on rent, Rs. 2,700 on food, Rs. 900 on the education of his children; Rs. 1,200 on Other things and saves the rest.
Draw a pie-chart to represent it.
Draw a histogram of the following distribution:
| Heights (in cm) | Number of students |
| 150 – 153 | 7 |
| 153 – 156 | 8 |
| 156 – 159 | 14 |
| 159 – 162 | 10 |
| 162 – 165 | 6 |
| 165 – 168 | 5 |
