Advertisements
Advertisements
Question
The difference between the highest and the lowest observations in a data is its ______.
Options
frequency
width
range
mode
Solution
The difference between the highest and the lowest observations in a data is its range.
Explanation:
Since, Range = Highest observation – Lowest observation
APPEARS IN
RELATED QUESTIONS
The heights of 10 girls were measured in cm and the results are as follows:
135, 150, 139, 128, 151, 132, 146, 149, 143, 141
- What is the height of the tallest girl?
- What is the height of the shortest girl?
- What is the range of the data?
- What is the mean height of the girls?
- How many girls have heights more than the mean height.
Find range of following data: 1, 0, 2, 3, 2, 6, 8, 10, 12, 12, 13.
The range of the data: 21, 6, 17, 18, 12, 8, 4, 13 is ______.
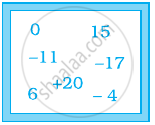
Some integers are marked on a board. What is the range of these integers?

Range of the data is always from the data.
The range of the data 2, –5, 4, 3, 7, 6 would change if 2 was subtracted from each value in the data.
The marks in a subject for 12 students are as follows:
31, 37, 35, 38, 42, 23, 17, 18, 35, 25, 35, 29
For the given data, find the range
The following are weights (in kg) of 12 people. 70, 62, 54, 57, 62, 84, 75, 59, 62, 65, 78, 60. Find the range of the given data.
Given below are heights of 15 boys of a class measured in cm:
128, 144, 146, 143, 136, 142, 138, 129, 140, 152, 144, 140, 150, 142, 154.
Find the range of the given data.
Age (in years) of 6 children of two groups are recorded as below:
| Age (in Years) | |
| Group A | Group B |
| 7 | 7 |
| 7 | 9 |
| 9 | 11 |
| 8 | 12 |
| 10 | 12 |
| 10 | 12 |
- Find the mode and range for each group.
- Find the range and mode if the two groups are combined together.
