Advertisements
Advertisements
Question
The heights of 10 girls were measured in cm and the results are as follows:
135, 150, 139, 128, 151, 132, 146, 149, 143, 141
- What is the height of the tallest girl?
- What is the height of the shortest girl?
- What is the range of the data?
- What is the mean height of the girls?
- How many girls have heights more than the mean height.
Solution
Arranging the heights of 10 girls in an ascending order,
128, 132, 135, 139, 141, 143, 146, 149, 150, 151
i. Height of the tallest girl = 151 cm
ii. Height of the shortest girl = 128 cm
iii. Range = (151 − 128) cm
= 23 cm
iv. Mean height = `(135 + 150 + 139 + 128 + 151 + 132 + 146 + 149 + 143 + 141)/10`
= `1414/10`
= 141.4 cm
v. The heights of 5 girls are greater than the mean height (i.e., 141.4 cm) and these heights are 143 cm, 146 cm, 149 cm, 150 cm and 151 cm.
APPEARS IN
RELATED QUESTIONS
The marks (out of 100) obtained by a group of students in a science test are 85, 76, 90, 85, 39, 48, 56, 95, 81 and 75. Find the:
- Highest and the lowest marks obtained by the students.
- Range of the marks obtained.
- Mean marks obtained by the group.
The rainfall (in mm) in a city on 7 days of a certain week was recorded as follows:
| Day | Monday | Tuesday | Wednesday | Thursday | Friday | Saturday | Sunday |
| Rainfall (in mm) | 0.0 | 12.2 | 2.1 | 0.0 | 20.5 | 5.5 | 1.0 |
- Find the range of the rainfall in the above data.
- Find the mean rainfall for the week.
- On how many days was the rainfall less than the mean rainfall.
Find range of following data: 1, 0, 2, 3, 2, 6, 8, 10, 12, 12, 13.
The ages in years of 10 teachers of a school are:
32, 41, 28, 54, 35, 26, 23, 33, 38, 40
(i) What is the age of the oldest teacher and that of the youngest teacher?(ii) What is the range of the ages of the teachers?
The difference between the highest and the lowest observations in a data is its ______.
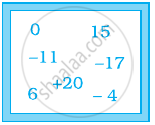
Some integers are marked on a board. What is the range of these integers?
The range of the data 2, –5, 4, 3, 7, 6 would change if 2 was subtracted from each value in the data.
The range of the data 3, 7, 1, –2, 2, 6, –3, –5 would change if 8 was added to each value in the data.
Given below are heights of 15 boys of a class measured in cm:
128, 144, 146, 143, 136, 142, 138, 129, 140, 152, 144, 140, 150, 142, 154
Find the height of the tallest boy.
Given below are heights of 15 boys of a class measured in cm:
128, 144, 146, 143, 136, 142, 138, 129, 140, 152, 144, 140, 150, 142, 154.
Find the range of the given data.
