Advertisements
Advertisements
Question
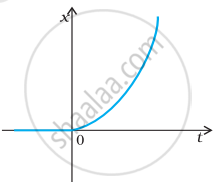
The figure shows the x-t plot of one-dimensional motion of a particle. Is it correct to say from the graph that the particle moves in a straight line for t < 0 and on a parabolic path for t > 0? If not, suggest a suitable physical context for this graph.
Solution
It is not correct to say that the particle moves in a straight line for t < 0 (i.e., -ve) and on a parabolic path for t > 0 (i.e., + ve) because the x-t graph can not show the path of the particle.
For the graph, a suitable physical context can be the particle thrown from the top of a tower at the instant t =0.
APPEARS IN
RELATED QUESTIONS
A police van moving on a highway with a speed of 30 km h–1 fires a bullet at a thief’s car speeding away in the same direction with a speed of 192 km h–1. If the muzzle speed of the bullet is 150 m s–1, with what speed does the bullet hit the thief’s car? (Note: Obtain that speed which is relevant for damaging the thief’s car).
Two projectiles A and B are projected with angle of projection 15° for the projectile A and 45° for the projectile B. If RA and RB be the horizontal range for the two projectiles, then
A particle moves along the X-axis as x = u (t − 2 s) + a (t − 2 s)2.
(a) the initial velocity of the particle is u
(b) the acceleration of the particle is a
(c) the acceleration of the particle is 2a
(d) at t = 2 s particle is at the origin.
A man has to go 50 m due north, 40 m due east and 20 m due south to reach a field. (a) What distance he has to walk to reach the field? (b) What is his displacement from his house to the field?
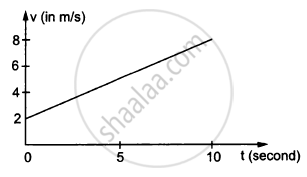
In the following figure Shows the graph of velocity versus time for a particle going along the X-axis. Find the acceleration
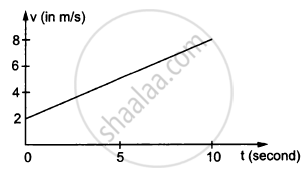
In the following figure Shows the graph of velocity versus time for a particle going along the X-axis. Find the distance travelled in 0 to 10s
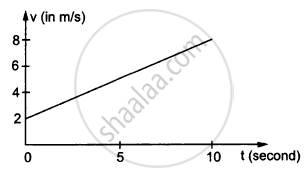
In the following figure Shows the graph of velocity versus time for a particle going along the X-axis. Find the displacement in 0 to 10 s.
A ball is dropped and its displacement vs time graph is as shown figure (displacement x is from ground and all quantities are +ve upwards).
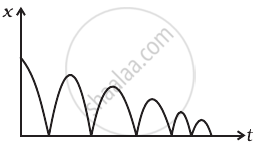
- Plot qualitatively velocity vs time graph.
- Plot qualitatively acceleration vs time graph.
Ship A is sailing towards the northeast with velocity `vecv = 30hati + 50hatj` km/hr where `hati` points east and `hatj`, north. Ship B is at a distance of 80 km east and 150 km north of Ship A and is sailing west at 10 km/hr. A will be at the minimum distance from B in ______.
A person moved from A to B on a circular path as shown in figure. If the distance travelled by him is 60 m, then the magnitude of displacement would be: (Given cos135° = - 0.7)
