English

The Following Bar Graph Shows the Number of Children, in Various Classes, in a School in Delhi. - Mathematics

Advertisements
Advertisements

Question

The following bar graph shows the number of children, in various classes, in a school in Delhi.
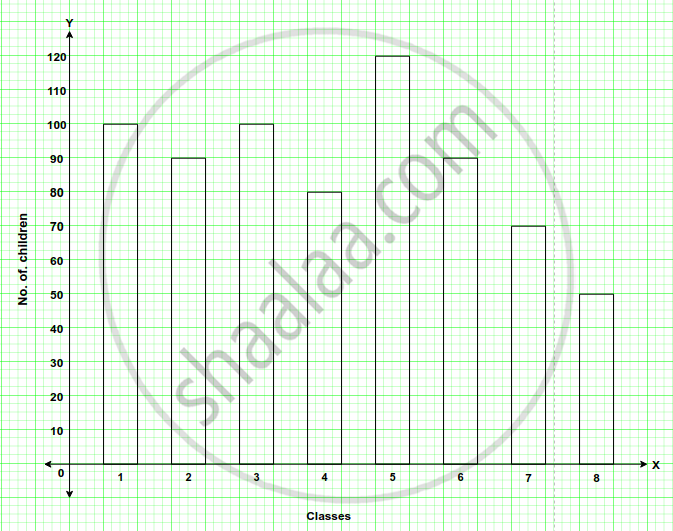
Using the given bar graph, find the total number of children from Class 6 to Class 8.

Graph
One Line Answer

Solution

Class 6 = 90,

Class 7 = 70,

Class 8 = 50,

Total number = 210

shaalaa.com
  Is there an error in this question or solution?
Chapter 33: Data Handling (Including Pictograph and Bar Graph) - Exercise 33 (C)

APPEARS IN

Selina Mathematics [English] Class 6
Chapter 33 Data Handling (Including Pictograph and Bar Graph)
Exercise 33 (C) | Q 8.2
Share
Notifications

Englishहिंदीमराठी


      Forgot password?
Use app×