Advertisements
Advertisements
Question
The following bar graph shows the number of children, in various classes, in a school in Delhi.
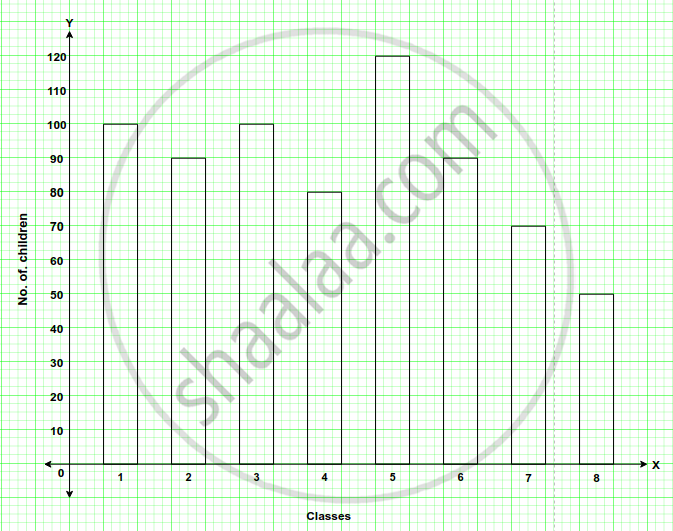
Using the given bar graph, find how many more children there are in Class 5 compared to Class 6?
Graph
One Line Answer
Solution
Number of student in class 5 = 120,
Number of student in class 6 = 90
More children is class 5 = (120 – 90) = 30
shaalaa.com
Is there an error in this question or solution?
