Advertisements
Advertisements
Question
The velocity-time plot for a particle moving on a straight line is shown in the figure.
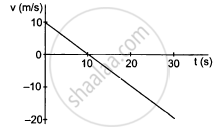
(a) The particle has a constant acceleration.
(b) The particle has never turned around.
(c) The particle has zero displacement.
(d) The average speed in the interval 0 to 10 s is the same as the average speed in the interval 10 s to 20 s.
Solution
(a) The particle has a constant acceleration.
(d) The average speed in the interval 0 s to 10 s is the same as the average speed in the interval 10 s to 20 s.
Explanation:
(a) The slope of the v–t graph gives the acceleration. For the given graph, the slope is constant. So, acceleration is constant.
(b) From 0 to 10 seconds, velocity is in positive direction and then in negative direction. This means that the particle turns around at t = 10 s.
(c) Area in the v–t curve gives the distance travelled by the particle.
Distance travelled in positive direction \[\neq\] Distance travelled in negative direction
∴ Displacement \[\neq\] Zero
(d) The area of the v–t graph from t = 0 s to t = 10 s is the same as that from t = 10 s to t= 20 s. So, the distance covered is the same. Hence, the average speed is the same.
APPEARS IN
RELATED QUESTIONS
A food packet is dropped from a plane going at an altitude of 100 m. What is the path of the packet as seen from the plane? What is the path as seen from the ground ? If someone asks "what is the actual path", what will you answer?
Mark the correct statements for a particle going on a straight line:
(a) If the velocity and acceleration have opposite sign, the object is slowing down.
(b) If the position and velocity have opposite sign the particle is moving towards the origin.
(c) If the velocity is zero at an instant, the acceleration should also be zero at that instant.
(d) If the velocity is zero for a time interval, the acceleration is zero at any instant within the time interval.
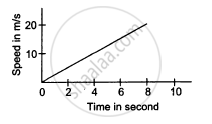
The speed of a car as a function of time is shown in the following figure. Find the distance travelled by the car in 8 seconds and its acceleration.
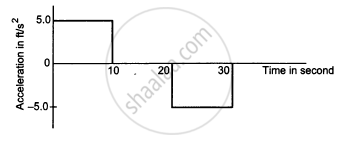
The acceleration of a cart started at t = 0, varies with time as shown in the following figure. Find the distance travelled in 30 seconds and draw the position-time graph.
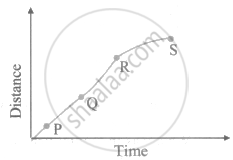
A particle shows distance-time curve as shown in the figure. The maximum instantaneous velocity of the particle is around the point