Advertisements
Advertisements
Question
What happens to the stepwise increasing speed-time graph when the size of each step is made very small?
Solution
The graph becomes straight line with positive slope with time axis and represents almost a constant acceleration.
APPEARS IN
RELATED QUESTIONS
Give one example of the following motion:
Uniform retardation
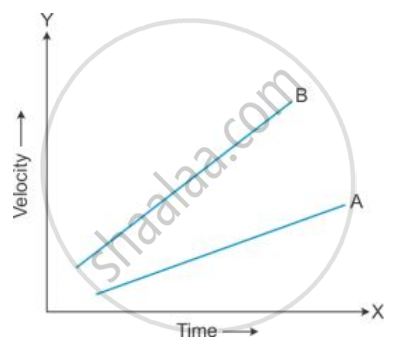
Figure shows the velocity-time graphs for two cars A and B moving in the same direction. Which car has greater acceleration? Give reasons to your answer.

A motor bike running at 5 ms−1, picks up a velocity of 30 ms−1 in 5s. Calculate
- acceleration
- distance covered during acceleration.
Define acceleration.
The distance covered by a body is directly proportional to the square of the time elapsed. What can you say about its acceleration?
A car accelerates uniformly from a velocity of 18 km/h to 36 km/h in 15 min. What is its acceleration?
What do you mean by constant acceleration?
A boy throws a ball up and catches it when the ball falls back. In which part of the motion the ball is accelerating?
If a moving body comes to rest, then its acceleration is ______.
Acceleration is defined as the rate of change of ______.
