Advertisements
Advertisements
Question
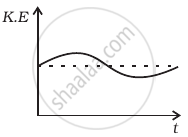
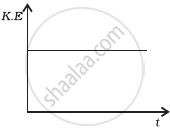
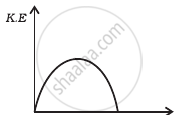
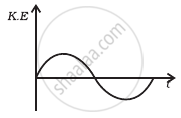
Which of the diagrams shown in figure most closely shows the variation in kinetic energy of the earth as it moves once around the sun in its elliptical orbit?
Options
MCQ
Solution

Explanation:
As the earth moves once around the sun in its elliptical orbit, when the earth is closest to the sun, the speed of the earth is maximum, hence KE is maximum. When the earth is farthest from the sun speed is minimum, hence KE is minimum but never zero and negative.
shaalaa.com
Is there an error in this question or solution?


