Advertisements
Advertisements
Question
Which one of the following figures represents the working age group of the population?
Options
15 to 65 years
15 to 64 years
15 to 66 years
15 to 59 years
Solution
15 to 59 years
APPEARS IN
RELATED QUESTIONS
Identify the correct co-relation :
A: Assertion; R: Reasoning
A: In the population pyramid, a broad base indicates a high number of children in a country.
R: Broad apex is an indicator of the high number of elderly in a country
Write a short note on literacy rate.
Differentiate between:
Expansive population pyramid and Constrictive population pyramid.
Ratio of males and females in the population is ______.
Identify the incorrect factor
Type of age-sex pyramid:
Identify the incorrect factor
Regions having literacy more than 80%:
Identify the incorrect factor
Difference in population according to rural-urban structure:
Differentiate between
Quaternary occupations and Quinary occupations
Observe the following graph and answer the question given below

Question:
- Which region has the highest literacy rate?
- Which region has the lowest literacy rate?
- In which region does women fare better than men in literacy rate?
- Write a concluding paragraph about the graph.
- Which is the type of graph?
Write short note
Rural-urban structure of population
Which one of the following states has the highest proportion of the urban population in India according to the 2001 Census?
What does age-sex pyramid define?
What does the literacy rate denote for India?
Why is an unfavorable female sex ratio found in India and other South Asian countries?
What do you mean by natural advantage and social disadvantage?
What was the percentage of urban population in the world in 2011?
Which country has the lowest sex ratio in the world?
Name the country where sex ratio is most unfavourable to women in the world.
“In some countries of the world, the sex ratio is unfavourable to women.” Give one reason.
Describe the main characteristics of each of the major groups of human occupations in the world.
Which state has the lowest literacy rate?
Which state has the highest % of the rural population?
Where does India rank in the world as regards area?
Which state has the highest sex ratio?
Which of the following is the largest religious minority in India?
A worker is known as main worker, who works atleast ____________.
Which one of the following reflected by Age-Sex pyramid?
How many types of Age-Sex Pyramid?
Bell shaped Pyramid refers to ______.
In European countries, a deficit of males is due to ______.
In which continent, low sex ratio is found?
The aging population has aged more than ______.
Expanding population pyranrd shows.
Which one of the following countries has the highest sex ratio in the world?
According to the UNO, how many countries have sex ratio unfavourable for females?
Which diagram shows age-sex structure?
Which country’s population shows a constant population?
Which of the following pairs is not matched correctly?
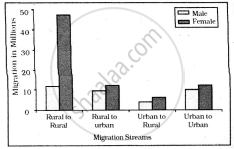
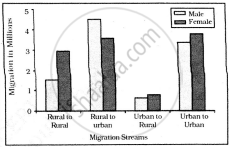
Study the given graph carefully and answer the following question:

Intra-state Migration by place of Last Residence Indicating Migration Streams India, 2011

Inter-state Migration by Place of Last Residence Indicating Migration Streams India, 2011
Who dominates rural to rural migration in inter-state migration?
Study the given graph carefully and answer the following question:

Intra-state Migration by place of Last Residence Indicating Migration Streams India, 2011

Inter-state Migration by Place of Last Residence Indicating Migration Streams India, 2011
What is the main cause of female migration from rural to urban?
The significance of age-structure is/are?
Sex ratio in the world is calculated as?
The developed countries having low birth and death rates come under which category?
Population composition means
Highest sex-ratio in the world is found in a country of which of the following continent?
The lowest sex ratio in the world is in which country?
Identify the country with the highest sex-ratio in the world.
Identify the correct group or factor.
Observe the following graph and answer the question given below.

- Which region has the highest literacy rate?
- Which region has the lowest literacy rate?
- In which region does women fare better than men in literacy rate?
- Write a concluding paragraph about the graph.
- What does this graph tells us?
Write a short note on:
Demographic dividend.
Which one of the following is the largest linguistic group of India?
Which one of the following is the largest linguistic group of India?
Which one of the following is the largest linguistic group of India?
