Advertisements
Advertisements
Question
With the help of a diagram, explain the relationship between Average Product and Total Product under the Law of Variable Proportions.
Solution
According to the Law of Variable Proportions, as a producer employs more units of a variable element, total production increases at first at an increasing pace, then at a declining rate, and ultimately starts to fall.
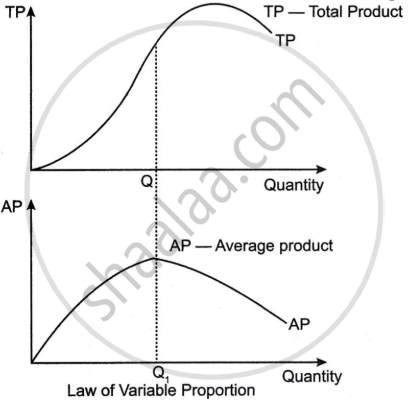
- The average product (AP) is calculated by dividing the total product (TP) by the variable factor quantity.
- The AP curve follows the TP curve, but it peaks before TP begins to decline.
- Initially, when TP increases at a rapid rate, AP rises.
- When TP starts to increase at a lower pace, AP reaches its maximum and begins to decline.
The connection shows that as more of the variable input is used, each new unit's contribution to the overall output increases initially.
APPEARS IN
RELATED QUESTIONS
State the different phases of change in the total product according to the Law of Variable Proportions. Use diagram
What are the different phases in the Law of Variable Proportions in terms of Total Product ? Give reasons behind each phase. Use diagram.
What is the law of variable proportions?
The short-run production is studied through
Modern economists have propounded the law of
Define Marginal Product of a factor.
Bring out the Relationship among Total, Average and Marginal Products.
When the Marginal Product turns negative, Total Product will ______.
Why is the AVC curve U-shaped?
At the point of inflexion, ______ is maximum.
What are Average product?
With the help of a suitable diagram, discuss the relationship between Average product and Marginal Product.
