Advertisements
Advertisements
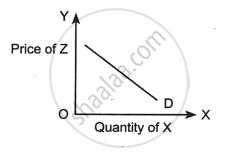
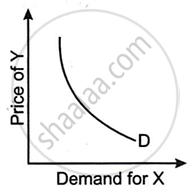
The figure given below shows the relation between the quantity demanded for the good X and the price of the good Z. What type of goods are X and Z?
Concept: Demand
Complete the following table:
| INCOME (Y) |
SAVING (S) |
APC |
| 0 | (-) 12 | |
| 20 | 6 |
Concept: Consumption Function and Propensity to Save
Give the meaning of deficient demand.
Concept: Problems of Excess Demand and Deficient Demand
Why is effective demand also known as expost demand?
Concept: Concept of Aggregate Demand and Aggregate Supply
Explain the concept of Investment Multiplier using a diagram.
Concept: Investment Multiplier and Its Mechanism
With the help of a diagram, explain how the consumer will attain equilibrium on the consumption of a single commodity at a given price.
Concept: Consumer's Equilibrium
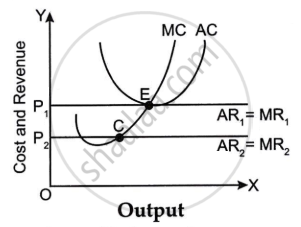
Refer to the diagram given below and choose the incorrect statement.
Concept: Equilibrium Output
If S > I, it will lead to ______.
Concept: Problems of Excess Demand and Deficient Demand
Mention any one difference between Induced investment and Autonomous investment.
Concept: Investment Multiplier and Its Mechanism
How is APS obtained from the APC?
Concept: Consumption Function and Propensity to Save
With reference to Simple Keynesian model, give the meaning of ex-ante demand.
Concept: Concept of Aggregate Demand and Aggregate Supply
Milk is used for making curd, sweets and chocolates.
What type of demand does milk have? Give a reason.
Concept: Demand
Milk is used for making curd, sweets and chocolates.
What type of demand does milk have? Give a reason.
Concept: Demand
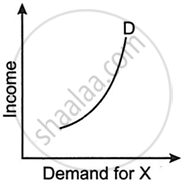
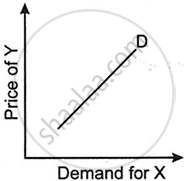
Figures (A), (B) and (C) given below represent different types of Demand curves.
 |
 |
 |
| (A) | (B) | (C) |
What kind of goods do each of these Demand curves represent? Give a reason for each of the curves.
Concept: Demand Curve and Its Slope
What is meant by autonomous consumption expenditure? Show it on a diagram.
Concept: Consumption Function and Propensity to Save
When National Income rises from ₹ 600 Cr. to ₹ 1000 Cr., the consumption expenditure increases from ₹ 500 Cr. to ₹ 800 Cr. Calculate MPC and hence the value of Investment Multiplier.
Concept: Consumption Function and Propensity to Save
Draw a straight-line demand curve joining both the axes. Indicate the following on the demand curve.
Elasticity of demand is equal to zero
Concept: Demand Curve and Its Slope
Draw a straight-line demand curve joining both the axes. Indicate the following on the demand curve.
Elasticity of demand is greater than one
Concept: Derivation of Demand Curve
Observe the graph given below and answer the question that follow.
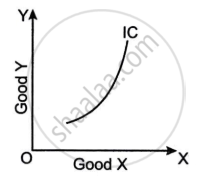
- Give a reason to explain if the graph shown above can be a common phenomenon or not. [2]
- What is an indifference map? Draw its diagram. [2]
- State any two differences between cardinal utility and ordinal utility. [2]
Concept: Indifference Curve
Refer to the diagram given below and answer the questions that follow.
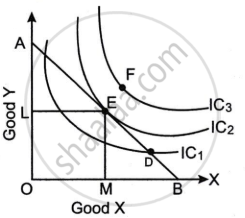
- What does the line AB represent? Why is the line AB negatively sloped? (2)
- At which one of the given points, D, E and F, will the consumer attain equilibrium? Explain. (2)
- Briefly explain why the consumer is not in equilibrium at the other two points. (2)
Concept: Consumer's Equilibrium
