Advertisements
Advertisements
प्रश्न
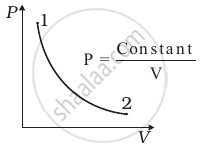
Consider P-V diagram for an ideal gas shown in figure.

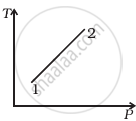
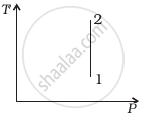
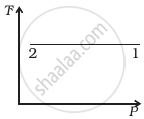
Out of the following diagrams (figure), which represents the T-P diagram?
 (i) |
 (ii) |
 (iii) |
 (iv) |
विकल्प
(iv)
(ii)
(iii)
(i)
MCQ
उत्तर

Explanation:
According to the P-V diagram provided in the question, P increases as V decreases at a constant temperature. So, it is Boyle's law. So, the temperature will remain constant in the TP graph and pressure will be higher at stage 1 than at stage 2.
shaalaa.com
Thermodynamic Process
क्या इस प्रश्न या उत्तर में कोई त्रुटि है?
