Advertisements
Advertisements
प्रश्न
Define the following term:
True class limits
उत्तर
True class limits are the actual class limits of a class.
APPEARS IN
संबंधित प्रश्न
Define the following term:
Grouped frequency distribution
Prepare a frequency table of the following scores obtained by 50 students in a test:
| 42, | 51, | 21, | 42, | 37, | 37, | 42, | 49, | 38, | 52, | 7, | 33, | 17, |
| 44, | 39, | 7, | 14, | 27, | 39, | 42, | 42, | 62, | 37, | 39, | 67, | 51, |
| 53, | 53, | 59, | 41, | 29, | 38, | 27, | 31, | 64, | 19, | 53, | 51, | 22, |
| 61, | 42, | 39, | 59, | 47, | 33, | 34, | 16, | 37, | 57, | 43, |
The following is the distribution of weights (in kg) of 52 persons:
| Weight in kg | Persons |
| 30-40 | 10 |
| 40-50 | 15 |
| 50-60 | 17 |
| 60-70 | 6 |
| 70-80 | 4 |
(i) What is the lower limit of class 50-60?
(ii) Find the class marks of the classes 40-50, 50-60.
(iii) What is the class size?
The heights (in cm) of 30 students of class VIII are given below:
155, 158, 154, 158, 160, 148, 149, 150, 153, 159, 161, 148, 157, 153, 157, 162, 159, 151, 154, 156, 152, 156, 160, 152, 147, 155, 163, 155, 157, 153.
Prepare a frequency distribution table with 160-164 as one of the class intervals.
The daily minimum temperatures in degrees Celsius recorded in a certain Arctic region are as follows:
−12.5, −10.8, −18.6, −8.4, −10.8, −4.2, −4.8, −6.7, −13.2, −11.8, −2.3, 1.2, 2.6, 0, −2.4, 0, 3.2, 2.7, 3.4, 0, −2.4, −2.4, 0, 3.2, 2.7, 3.4, 0, −2.4, −5.8, −8.9, −14.6, −12.3, −11.5, −7.8, −2.9
Represent them as frequency distribution table taking − 19.9 to − 15 as the first class interval.
The tally marks for the number 7 in standard form is _____________
The heights (in centimeters) of 40 children are.
| 110 | 112 | 112 | 116 | 119 | 111 | 113 | 115 | 118 | 120 |
| 110 | 113 | 114 | 111 | 114 | 113 | 110 | 120 | 118 | 115 |
| 112 | 110 | 116 | 111 | 115 | 120 | 113 | 111 | 113 | 120 |
| 115 | 111 | 116 | 112 | 110 | 111 | 120 | 111 | 120 | 111 |
Prepare a tally marks table
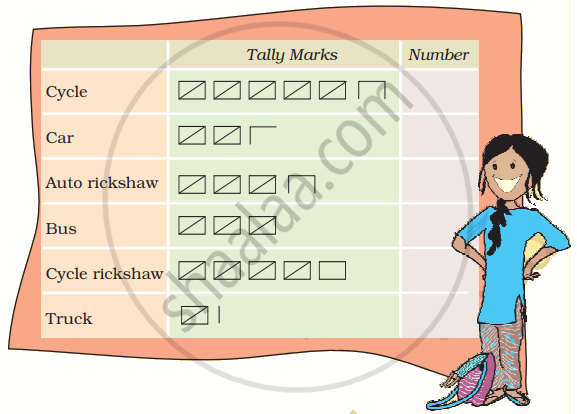
Sumita stood on the road for half an hour and counted the number of vehicles passing by. She made a tally mark for each vehicle. This helped her in counting the total number of vehicles in each group.

- Write the number of each vehicle in the table.
- How many vehicles in all did Sumita see on the road in half an hour?
- Auto rickshaws are thrice the number of trucks — true/false?
- Make tally marks for 7 more buses and 2 more trucks.
Data available in an unorganised form is called ______ data.
In an examination, the grades achieved by 30 students of a class are given below. Arrange these grades in a table using tally marks:
B, C, C, E, A, C, B, B, D, D, D, D, B, C, C, C, A, C, B, E, A, D, C, B, E, C, B, E, C, D
