Advertisements
Advertisements
प्रश्न
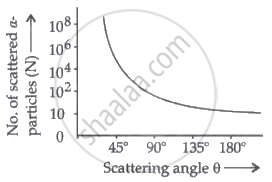
Draw a graph showing the variation of the number of particles scattered (N) with the scattering angle θ in the Geiger-Marsden experiment. Why only a small fraction of the particles are scattered at θ > 90°?
उत्तर
Graph showing the variation of the number of particles scattered (N) with the scattering angle (θ):

The strongly repulsive force exerted by the positively charged nucleus causes the scattering of α-particles at θ > 90°. Because the nucleus is so small, there are fewer distributed α-particles.
संबंधित प्रश्न
With the help of a neat labelled diagram, describe the Geiger- Marsden experiment
Answer the following question, which help you understand the difference between Thomson’s model and Rutherford’s model better.
Is the probability of backward scattering (i.e., scattering of α-particles at angles greater than 90°) predicted by Thomson’s model much less, about the same, or much greater than that predicted by Rutherford’s model?
Define the distance of closest approach. An α-particle of kinetic energy 'K' is bombarded on a thin gold foil. The distance of the closest approach is 'r'. What will be the distance of closest approach for an α-particle of double the kinetic energy?
The total energy of an electron in the ground state of the hydrogen atom is -13·6 eV. Its total energy, when a hydrogen atom is in the first excited state, is ______.
The model that best explains the results of Geiger-Marsden experiment is ______.
If the radius of second electron orbit in hydrogen atom be r then the radius of the third orbit will be ______.
Which one of the following statements does not hold good when two balls of masses m1 and m2 undergo elastic collision?
The ratio active Nude 7N13 decays 6C13 through the emission of
The ratio of minimum to maxm wavelength in ballmer series is:-
Radius of the 1st orbit of hydrogen atom is r0. What will be the radius of the 4th orbit?
