Advertisements
Advertisements
प्रश्न
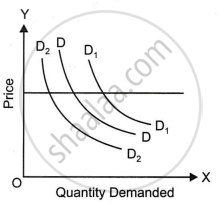
Explain the diagram given alongside.
उत्तर
The diagram shows change in demand. DD is the initial demand curve. Price remaining the same (at OP level) when demand rises due to change in factors other than price, demand curve shifts from DD to D1D1 indicating increase in demand. Demand curve shifts to the left as denoted by demand curve D2D2 indicates decrease in demand when other factors become favourable.
APPEARS IN
संबंधित प्रश्न
When the demand curve of a product shifts to the right, it represents a situation of ______.
An increase in the price of electricity, will curve the demand for electric appliances to ______.
The goods whose demand decreases as income increases.
If X and Y are complementary goods, a rise in the price of Y will cause the demand curve of X to ______.
Match the following:
| Column I | Column II |
| A. Extension of demand. | (i) A larger quantity is demanded at the same price. |
| B. Contraction of demand. | (ii) A smaller quantity is demanded at the same price. |
| C. Increase in demand. | (iii) Fall in quantity demanded due to the rise in its price. |
| D. Decrease in demand | (iv) Rise in the quantity demanded of a commodity as a result of fall in the price. |
What is increase in demand?
Differentiate between a change in quantity demanded and a change in demand.
The following table shows a change in the demand. Read the table carefully and answer the question that follows:
| Case | Price (₹) | Quantity (kg) |
| I | 10 | 20 |
| 10 | 10 | |
| II | 10 | 20 |
| 5 | 20 |
What type of change is it - decrease in demand or contraction in demand? Give a reason.
What does a rightward shift of demand curve indicate?
The following table shows a change in the demand. Read the table carefully and answer the question that follows:
| Case I | Case II | ||
| Price (₹) | Quantity | Price (₹) | Quantity |
| 10 | 20 | 10 | 20 |
| 10 | 10 | 5 | 20 |
What type of change is it, decrease in demand or contraction in demand? Give a reason.
