Advertisements
Advertisements
प्रश्न
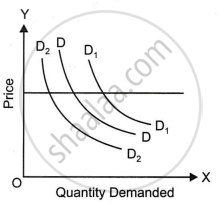
Explain the diagram given alongside.
उत्तर
The diagram shows change in demand. DD is the initial demand curve. Price remaining the same (at OP level) when demand rises due to change in factors other than price, demand curve shifts from DD to D1D1 indicating increase in demand. Demand curve shifts to the left as denoted by demand curve D2D2 indicates decrease in demand when other factors become favourable.
APPEARS IN
संबंधित प्रश्न
What does a downward movement along the same demand curve indicate?
An increase in the price of electricity, will curve the demand for electric appliances to ______.
Mr Vijay purchases 2 litres of milk per day when it is priced at ₹ 35 per litre. Suppose he has some guests at home and consequently he purchases 6 litres of milk on that day. What will you call it?
If X and Y are complementary goods, a rise in the price of Y will cause the demand curve of X to ______.
An increase in the price of electricity will cause an ______.
With the help of a suitable diagram explain the extension in demand?
What is decrease in demand?
There are train and bus services between New Delhi and Jaipur. Suppose, the train fare between the two cities comes down. How will this affect the demand curve for bus travel between the two cities?
State two types of related goods.
What does a rightward shift of demand curve indicate?
