Advertisements
Advertisements
Question
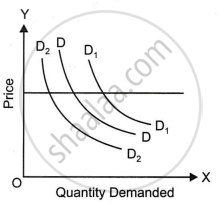
Explain the diagram given alongside.

Solution
The diagram shows change in demand. DD is the initial demand curve. Price remaining the same (at OP level) when demand rises due to change in factors other than price, demand curve shifts from DD to D1D1 indicating increase in demand. Demand curve shifts to the left as denoted by demand curve D2D2 indicates decrease in demand when other factors become favourable.
APPEARS IN
RELATED QUESTIONS
The goods whose demand decreases as income increases.
If X and Y are complementary goods, a rise in the price of Y will cause the demand curve of X to ______.
How does an increase in income affect the demand for a normal good?
With the help of a suitable diagram explain the extension in demand?
What is increase in demand?
What is decrease in demand?
Differentiate between a change in quantity demanded and a change in demand.
There are train and bus services between New Delhi and Jaipur. Suppose, the train fare between the two cities comes down. How will this affect the demand curve for bus travel between the two cities?
State two types of related goods.
What does a rightward shift of demand curve indicate?
