Advertisements
Advertisements
प्रश्न
From the diagram given below, calculate deceleration.

उत्तर

Deceleration = Slope of v.t. graph from A to B
= `"AC"/"CB"=15/(16-10)=15/6` = 2.5 ms−2
APPEARS IN
संबंधित प्रश्न
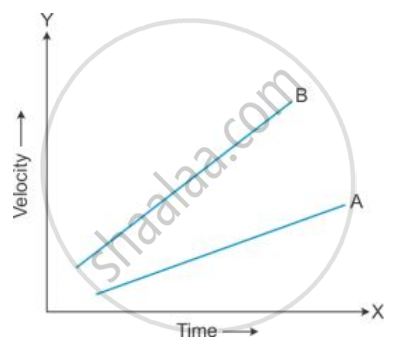
Figure shows the velocity-time graphs for two cars A and B moving in the same direction. Which car has greater acceleration? Give reasons to your answer.

Give an example of an accelerated body, moving with a uniform speed.
From the diagram given below, calculate acceleration.

From the velocity – time graph given below, calculate deceleration in region BC.

The distance covered by a body is directly proportional to the square of the time elapsed. What can you say about its acceleration?
A car is moving with a speed of 50 km/h. One second later, its speed is 55 km/h. What is its acceleration?
A car accelerates to a velocity of 30 m/s in 10 s and then decelerates for 20 s so that it stops. Draw a velocity-time graph to represent the motion and find:
Distance travelled
A boy throws a ball up and catches it when the ball falls back. In which part of the motion the ball is accelerating?
An object can be moving with uniform speed but with variable acceleration.
Assertion: A negative acceleration of a body can be associated with speeding up of the body.
Reason: Increase in the speed of a moving body is independent of its direction of motion.
