Advertisements
Advertisements
प्रश्न
Observe the chart and graph given in figure carefully and answer the following questions.
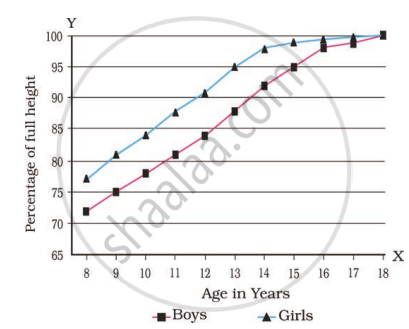
| Age in Years | % of full height | |
| Boys | Girls | |
| 8 | 72% | 77% |
| 9 | 75% | 81% |
| 10 | 78% | 84% |
| 11 | 81% | 88% |
| 12 | 84% | 91% |
| 13 | 88% | 95% |
| 14 | 92% | 98% |
| 15 | 95% | 99% |
| 16 | 98% | 99.5% |
| 17 | 99% | 100% |
| 18 | 100% | 100% |
- Which of the line represents the height of boys?
- Which line represents the height of girls?
- What is the difference between the pattern of increase in the height of boys and girls?
- Is this pattern true for each individual?
उत्तर
-
The dotted line represents the height of boys.
-
The solid line represents the height of girls.
-
At the omset of puberty, girls grow faster in height than the boys and by the age of 18 years, approximately both reach their maximum height.
-
No, the rate of growth in height varies among individuals. Some may grow in height suddenly at puberty and then slow down, while others may grow gradually.
APPEARS IN
संबंधित प्रश्न
Amniocentesis for sex determination is banned in our country. Is this ban necessary? Comment.
Write the full form of the following as it occur in biology :
STD
Name the contraceptive device used by the human males which acts as a sheath over the male organ and traps the sperms in it.
What substances are contained in oral pills, used as contraceptives? How do they work?
What is the name of surgical method of birth control (or preventing pregnancy) which is carried out in women?
What is contraception ? List three reasons for adopting contraceptive methods.
Name the kind of diseases/disorders and any two symptoms that are likely to occur in humans if Mutation in the gene that codes for an enzyme phenylalanine hydroxylase occurs.
RCH stands for ______.
Trace the path of sperm during ejaculation and mention the gland and their functions associated with the male reproductive system.
Amniocentesis technique is ______.
