Advertisements
Advertisements
प्रश्न
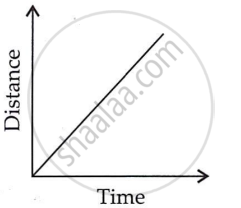
Show the shape of the distance-time graph for the motion in the following case:
A car moving with a constant speed.
उत्तर
A car moving with a constant speed covers an equal distance in equal intervals of time.
Such motion of the car is represented in the given distance-time graph.
APPEARS IN
संबंधित प्रश्न
What can you say about the motion of an object if its speed-time graph is a straight line parallel to the time axis?
A driver of a car travelling at 52 km h−1 applies the brakes and accelerates uniformly in the opposite direction. The car stops in 5 s. Another driver going at 3 km h−1 in another car applies his brakes slowly and stops in 10 s. On the same graph paper, plot the speed versus time graphs for the two cars. Which of the two cars travelled farther after the brakes were applied?
Given figure shows the distance-time graph of three objects A, B and C. Study the graph and answer the following questions:
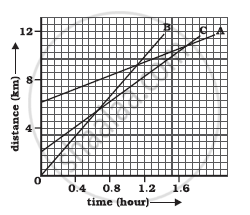
- Which of the three is travelling the fastest?
- Are all three ever at the same point on the road?
- How far has C travelled when B passes A?
- How far has B travelled by the time it passes C?
The speed-time graph for a car is shown in the following figure:
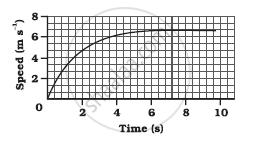
- Find how far the car travels in the first 4 seconds. Shade the area on the graph that represents the distance travelled by the car during the period.
- Which part of the graph represents uniform motion of the car?
A car is travelling at 20 m/s along a road. A child runs out into the road 50 m ahead and the car driver steps on the brake pedal. What must the car’s deceleration be if the car is to stop just before it reaches the child ?
Four cars A, B, C and D are moving on a levelled, straight road. Their distance-time graphs are shown in the given figure. Which of the following is the correct statement regarding the motion of these cars?
Figure (a) shows the displacement-time graph for the motion of a body. Use it to calculate the velocity of the body at t = 1 s, 2 s and 3 s, and then draw the velocity-time graph in Figure (b) for it.
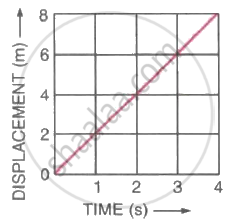 |
 |
| (a) | (b) |
A spaceship is moving in space with a velocity of 60 kms−1. It fires its retro engines for 20 seconds and velocity is reduced to 55 kms−1. Calculate the distance travelled by a spaceship in 40 s, from the time of firing of the retro- rockets.
What are the uses of the graphical study of motion?
Complete the data of the table given below with the help of the distance-time graph given in Figure 13.6
| Distance (m) | 0 | 4 | ? | 12 | ? | 20 |
| Time (s) | 0 | 2 | 4 | ? | 8 | 10 |

