Advertisements
Advertisements
प्रश्न
Show variation of resistivity of copper as a function of temperature in a graph.
Show the variation of resistivity of copper with rise in temperature.
उत्तर
The relationship between the resistivity of copper and temperature is parabolic. The graph indicates that the resistivity of copper escalates with an increase in temperature. It is acknowledged that, regardless of the temperature, copper possesses a specific resistance.

APPEARS IN
संबंधित प्रश्न
Define current density. Write an expression which connects current density with drift speed
The heat developed in a system is proportional to the current through it.
The specification on a heater coil is 250 V, 500 W. Calculate the resistance of the coil. What will be the resistance of a coil of 1000 W to operate at the same voltage?
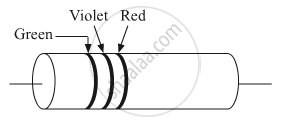
A carbon resistor is shown in the figure. Using color code, write the value of the resistance.
Fill in the blank.
The ___________, a property of materials C, Si, and Ge depends upon the energy gap between their conduction and valence bands.
Assertion: Bending a wire does not effect electrical resistance.
Reason: Resistance of wire is proportional to resistivity of material.
A constant voltage is applied between the two ends of a uniform metallic wire, heat ‘H’ is developed in it. If another wire of the same material, double the radius and twice the length as compared to the original wire is used then the heat developed in it will be -
The equivalent resistance between A and B is ____________.

A man covers his body with a blanket of thickness 4 mm. His temperature is 37°C and that of the atmosphere is 27°C. If the coefficient of thermal conductivity of wool is 1.2 × 10⁻⁵ MKS units, heat lost by him per hour per square meter area is:
As the temperature of conductor increase, it's resistivity and conductivity change. The ratio of resistivity to conductivity.
