Advertisements
Advertisements
Questions
Show variation of resistivity of copper as a function of temperature in a graph.
Show the variation of resistivity of copper with rise in temperature.
Solution
The relationship between the resistivity of copper and temperature is parabolic. The graph indicates that the resistivity of copper escalates with an increase in temperature. It is acknowledged that, regardless of the temperature, copper possesses a specific resistance.

APPEARS IN
RELATED QUESTIONS
Define current density. Write an expression which connects current density with drift speed
Define the term 'electrical conductivity' of a metallic wire. Write its S.I. unit.
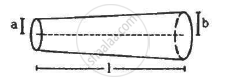
The following figure shows a conductor of length l with a circular cross-section. The radius of the cross-section varies linearly from a to b. The resistivity of the material is ρ. Assuming that b – a << l, find the resistance of the conductor.
For a metallic conductor, what is the relation between current density (J), conductivity (σ) and electric field intensity (E)?
In Figure 3 given below, find the value of resistance x for which points A and B are at the same potential:
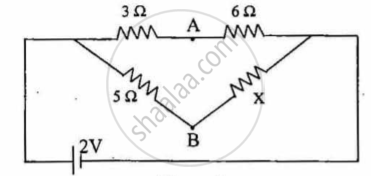
figure 3
What is the colour code of a carbon resistor having a resistance of 470 Ω and a tolerance of 5%?
Two cells of 1.25 V and 0.75 V are connected in series with anode of one connected to cathode of the other. The effective voltage will be ______.
Consider a current carrying wire (current I) in the shape of a circle.
As the temperature of conductor increase, it's resistivity and conductivity change. The ratio of resistivity to conductivity.
