Advertisements
Advertisements
प्रश्न
Show variation of resistivity of copper as a function of temperature in a graph.
Show the variation of resistivity of copper with rise in temperature.
उत्तर
The relationship between the resistivity of copper and temperature is parabolic. The graph indicates that the resistivity of copper escalates with an increase in temperature. It is acknowledged that, regardless of the temperature, copper possesses a specific resistance.

APPEARS IN
संबंधित प्रश्न
Using the concept of free electrons in a conductor, derive the expression for the conductivity of a wire in terms of number density and relaxation time. Hence obtain the relation between current density and the applied electric field E.
Define the term 'electrical conductivity' of a metallic wire. Write its S.I. unit.
A heater coil is to be constructed with a nichrome wire (ρ = 1.0 × 10⁻⁶ Ωm) that can operate at 500 W when connected to a 250 V supply. (a) What would be the resistance of the coil? (b) If the cross-sectional area of the wire is 0.5 mm2, what length of the wire will be needed? (c) If the radius of each turn is 4.0 mm, how many turns will be there in the coil?
What is the colour code of a carbon resistor having a resistance of 470 Ω and a tolerance of 5%?
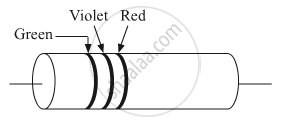
A carbon resistor is shown in the figure. Using color code, write the value of the resistance.
Consider a current carrying wire (current I) in the shape of a circle.
A man covers his body with a blanket of thickness 4 mm. His temperature is 37°C and that of the atmosphere is 27°C. If the coefficient of thermal conductivity of wool is 1.2 × 10⁻⁵ MKS units, heat lost by him per hour per square meter area is:
Consider four conducting materials copper, tungsten, mercury and aluminium with resistivity ρC, ρT, ρM and ρA respectively. Then:
