Advertisements
Advertisements
प्रश्न
State and explain the ‘law of demand’ with its exceptions.
Explain the law of demand and its exceptions.
उत्तर
Prof. Alfred Marshall introduced the law of demand in his book, ‘Principles of Economics' published in 1890. The law explains the functional relationship between price and quantity demanded.
- Statement of the Law: According to Prof. Alfred Marshall, “Other things being equal, higher the price of a commodity, smaller is the quantity demanded and lower the price of a commodity, larger is the quantity demanded”. Explanation: Other factors remain constant: when the price of a commodity rises, demand for it falls, and when the price of a commodity falls, demand for it rises. Thus, there is an inverse relationship between price and quantity demanded.
- Demand Schedule:
The law of demand is explained with the help of the following demand schedule:
Demand Schedule Price of commodity
‘x’ (in ₹)Quantity demanded
per week (in kg)10 1 8 2 6 3 4 4 2 5 - From the above schedule, it can be observed that when the price of the commodity is ₹ 10, the demand is 1 kg.
- When the price falls from ₹ 10 to ₹ 8, the demand rises from 1 kg to 2 kg.
- Similarly, as the price falls from ₹ 8 to 6 and from ₹ 6 to 4, the demand rises from 2 kg to 3 kg and 3 kg to 4 kg, respectively.
- If we look at the schedule from bottom to top, when the price rises from ₹ 2 to ₹ 4, the demand falls from 5 kg to 4 kg.
- Thus, we can conclude that as the price of a commodity falls, the quantity demanded rises, and when the price of the commodity rises, the quantity in demand falls.
- This shows an inverse relationship between price and quantity demanded.
- Demand Curve:
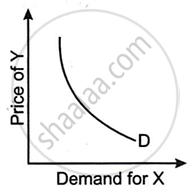
The law of demand can be further explained with the help of the following demand curve: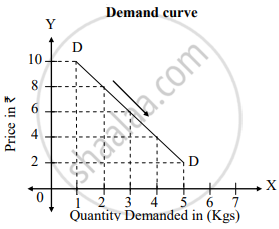
In the above diagram, the Y-axis represents price, and the X-axis represents quantity demanded. DD is the demand curve that slopes downward from left to right. It represents the inverse relation between price and quantity in demand. - Exceptions: The exceptions to the law are as follows:
- Giffen's paradox: Giffen Goods are inferior or low-quality goods like vanaspati ghee (Dalda), low-quality rice, etc. These are goods whose demand does not rise, even if their price falls. This happens because every person wants to increase their standard of living constantly.
Sir Robert Giffen observed this behaviour related to bread (an inferior good) in England. People had limited money, so they consumed more bread (a cheaper commodity) and less meat (a costlier commodity). He observed that when the price of bread decreased, less bread was demanded than before. The people saved money and used it to purchase meat, and thus, the demand for meat increased. This behaviour is called “Giffen’s paradox”. There is a direct relationship between price and quantity demanded in the case of Giffen goods. The demand curve for Giffen goods slopes upward from left to right. - Speculation: The law of demand does not hold true when people expect prices to rise further. In this case, although prices have risen today, consumers will demand more in anticipation of a further rise in the price.
For example, during the epic lockdown in March 2020, people expected the prices of goods to rise in the future. Therefore, they purchased goods in large quantities, even at high prices. - Habitual Goods: If a person is habituated to or addicted to certain goods, his demand for these goods will continue to be the same even if the price of such goods rises.
For example, people addicted to social media like FB, TikTok, Instagram, etc., will not reduce their usage even if the data packs or internet usage rates are increased. - Illusion of Price: Consumers may believe that high-priced goods are of better quality; therefore, demand for such goods tends to increase with an increase in their prices.
For example, expensive branded products are in demand, even at high prices. - Prestige Goods: Prestige goods are regarded as a status symbol in society. Rich people may demand more of these goods when their prices rise to show off.
E.g. Gold, diamonds, expensive watches, luxury cars, etc. - Fashion: A product that is out of fashion (E.g. keypad phones) will have less demand even if the price falls. A product in fashion (E.g. Smartphones) will have a high demand even if the price rises. Thus, it is an exception to the law.
- Ignorance: Sometimes, people buy more of a commodity at high prices due to ignorance. This may happen because the consumer is not aware of the cost of the commodity at other places.
- Necessities: The demand for specific necessities like basic foodstuffs (wheat, salt, dal, etc.) will not change due to a change in their prices.
- Demonstration Effect: The tendency of the low-income group to imitate the consumption pattern of high-income groups is known as the demonstration effect.
For example, the T-shirts “Being Human” by Salman Khan are in very high demand despite their high prices.
- Giffen's paradox: Giffen Goods are inferior or low-quality goods like vanaspati ghee (Dalda), low-quality rice, etc. These are goods whose demand does not rise, even if their price falls. This happens because every person wants to increase their standard of living constantly.
APPEARS IN
संबंधित प्रश्न
Explain the law of demand with its assumptions.
When does ‘increase’ in demand take place?
Explain the effect of change in prices of the related goods on demand for the given good.
Prices of other goods and demand for the given good.
Explain how do the following influence demand for a good:
i. Rise in income of the consumer.
ii. Fall in prices of the related goods
Distinguish between individuals demand and market demand.
Good Y is a substitute of good X. The price of Y falls. Explain the chain of effects of this change in the market of X.
How does change in the price of a substitute good affect the demand of the given good? Explain with the help of an example.
What does a rightward shift of demand curve indicate?
Fill in the blank using proper alternative given in the bracket:
Market demand is a total demand of...............buyers.
Define or explain the following concept.
Market Demand .
State with reason, whether you Agree or Disagree with the following statement.
The demand curve slopes downward from left to right.
Write explanatory notes or answer the following.
Aggregate demand
Do you agree with the following statement? Give reason
There are no exceptions to the law of demand.
Do you agree with the following statement? Give reason
State and explain the law of demand.
State with reasons whether you ‘agree’ or ‘disagree’ with the following statement.
Demand curve slopes downward from left to right.
Statements related to decrease in demand
- It is a type of change in demand
- It takes place due to unfavourable changes in other factors like tastes, income etc.
- Price remains constant
- Demand curve shifts to the right hand side of the original demand curve
Assertion (A): Under exceptional cases, demand curve has a positive slope.
Reasoning (R): In exceptional cases, consumer buys more when the price of a commodity rises and buys less when the price of commodity falls.
The shape of supply curve is ______
The demand curve for foreign exchange is ______
Identify the correctly matched items from Column I to that of Column II:
| Column I | Column II |
| (1) Demand Curve of Perfect Competition | (a) V-shaped Curve |
| (2) Demand Curve of Monopoly | (b) U-shaped Curve |
| (3) Demand Curve of Monopolistic Competition | (c) Upward rising |
| (4) Demand Curve of Oligopoly | (d) In-determinant |
Assertion (A): The demand curve is downward sloping.
Reason (R): The income effect means with a fall in the price of a good, the consumer's real income or purchasing power rises and he demands more units of the good.
In case of perfect competition, AR curve is:
Explain why the demand curve slopes downwards.
- Assertion (A): The demand curve slopes downwards.
- Reasoning (R): A fall in the price of goods increases the real income of the consumer enabling him/her to buy more.
Study the following table and answer the questions:
| Price of Ice Cream (₹) | Quantity Supplied | Market Supply | ||
| Seller A | Seller B | Seller C | (A + B + C) | |
| 50 | 0 | 2 | 5 | 7 |
| 100 | 1 | `square` | 10 | 15 |
| 150 | `square` | 6 | 15 | 23 |
| 200 | 3 | 8 | 20 | `square` |
| 250 | 4 | 10 | `square` | 39 |
Questions:
- Complete the above table.
- State whether the following statements are True or False.
(a) Market supply has a direct relation to price.
(b) As the price rises from ₹50 to ₹250, market supply rises from 7 to 39. This indicates an increase in supply.
Study the following diagram and answer the questions:
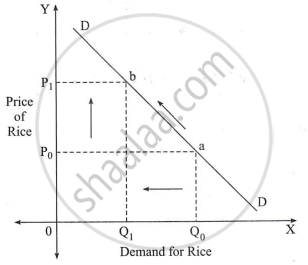
Questions:
- In which direction does the demand curve slope?
- What is the reason for the fall in demand of rice from Q0 to Q1?
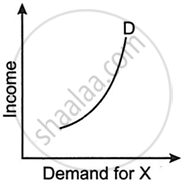
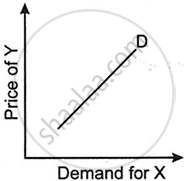
Figures (A), (B) and (C) given below represent different types of Demand curves.
 |
 |
 |
| (A) | (B) | (C) |
What kind of goods do each of these Demand curves represent? Give a reason for each of the curves.
Draw a straight-line demand curve joining both the axes. Indicate the following on the demand curve.
Elasticity of demand is equal to zero
