Advertisements
Advertisements
प्रश्न
When does ‘increase’ in demand take place?
उत्तर
An increase in the demand is caused by a change in the factors other than own price of the good. It includes an increase in income, change in taste and preferences of the good. Diagrammatically, it is shown as a forward shift in the demand curve.
APPEARS IN
संबंधित प्रश्न
State and explain the ‘law of demand’ with its exceptions.
Market of a commodity is in equilibrium. Demand for the commodity "increases." Explain the chain of effects of this change till the market again reaches equilibrium. Use diagram.
Explain how do the following influence demand for a good:
i. Rise in income of the consumer.
ii. Fall in prices of the related goods
Good Y is a substitute of good X. The price of Y falls. Explain the chain of effects of this change in the market of X.
How does change in the price of a substitute good affect the demand of the given good? Explain with the help of an example.
What does a rightward shift of demand curve indicate?
Fill in the blank using proper alternative given in the bracket:
Market demand is a total demand of...............buyers.
Define or explain the following concept.
Market Demand .
The shape of supply curve is ______
The demand curve for foreign exchange is ______
Assertion (A): The demand curve is downward sloping.
Reason (R): The income effect means with a fall in the price of a good, the consumer's real income or purchasing power rises and he demands more units of the good.
In case of perfect competition, AR curve is:
Study the following table and answer the questions:
| Price of Ice Cream (₹) | Quantity Supplied | Market Supply | ||
| Seller A | Seller B | Seller C | (A + B + C) | |
| 50 | 0 | 2 | 5 | 7 |
| 100 | 1 | `square` | 10 | 15 |
| 150 | `square` | 6 | 15 | 23 |
| 200 | 3 | 8 | 20 | `square` |
| 250 | 4 | 10 | `square` | 39 |
Questions:
- Complete the above table.
- State whether the following statements are True or False.
(a) Market supply has a direct relation to price.
(b) As the price rises from ₹50 to ₹250, market supply rises from 7 to 39. This indicates an increase in supply.
Study the following diagram and answer the questions:
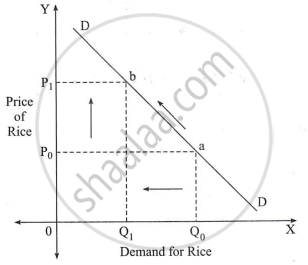
Questions:
- In which direction does the demand curve slope?
- What is the reason for the fall in demand of rice from Q0 to Q1?
Figures (A), (B) and (C) given below represent different types of Demand curves.
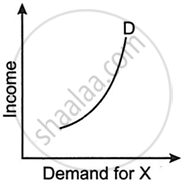 |
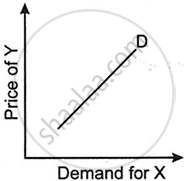 |
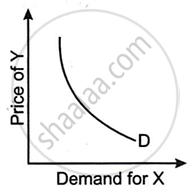 |
| (A) | (B) | (C) |
What kind of goods do each of these Demand curves represent? Give a reason for each of the curves.
