Advertisements
Advertisements
प्रश्न
State whether true or false. If false, correct the statement.
The velocity – time graph of a particle falling freely under gravity would be a straight line parallel to the x axis.
विकल्प
True
False
उत्तर
False,
Correct statement: The velocity time graph of a particle falling freely under gravity would be a straight line perpendicular to the x axis.
APPEARS IN
संबंधित प्रश्न
Draw a velocity-time graph to show the following motion :
A car accelerates uniformly from rest for 5 s ; then it travels at a steady’ velocity for 5 s.
A body is moving uniformly in a straight line with a velocity of 5 m/s. Find graphically the distance covered by it in 5 seconds.
From the displacement-time graph of a cyclist given below in the Figure, find The time after which he reaches the starting point .

Diagram shows a velocity – time graph for a car starting from rest. The graph has three sections AB, BC and CD.

Compare the distance travelled in section BC with the distance travelled in section AB.
A train starting from rest picks up a speed of 20 ms−1 in 200 s. It continues to move at the same rate for the next 500 s and is then brought to rest in another 100 s.
- Plot a speed-time graph.
- From graph calculate
(a) uniform rate of acceleration
(b) uniform rate of retardation
(c) total distance covered before stopping
(d) average speed.
Diagram is given below shows velocity – time graph of car P and Q, starting from the same place and in the same direction. Calculate which car is ahead after 10 s and by how much?

Draw distance-time graph to show:
Decreasing velocity
Figure shows the distance-time graph of three students A, B and C. On the basis of the graph, answer the following :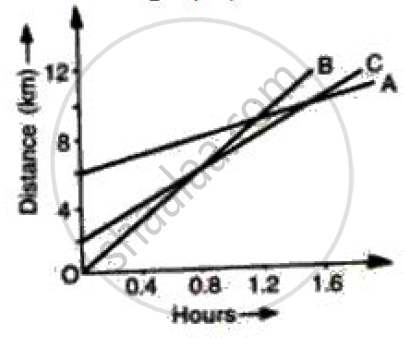
Will the three ever meet at any point on the road?
From the v-t graph, ______ can be calculated.
An object is moving in a positive direction with positive acceleration. The velocity-time graph with constant acceleration which represents the above situation is:
