Advertisements
Advertisements
प्रश्न
The following table gives the life times of 400 neon lamps:-
| Life time (in hours) | Number of lamps |
| 300 - 400 | 14 |
| 400 - 500 | 56 |
| 500 - 600 | 60 |
| 600 - 700 | 86 |
| 700 - 800 | 74 |
| 800 - 900 | 62 |
| 900 - 1000 | 48 |
- Represent the given information with the help of a histogram.
- How many lamps have a life time of more than 700 hours?
उत्तर
(i) By taking the life time (in hours) of neon lamps on the x-axis and the number of lamps on the y-axis, the histogram of the given information can be drawn as follows:
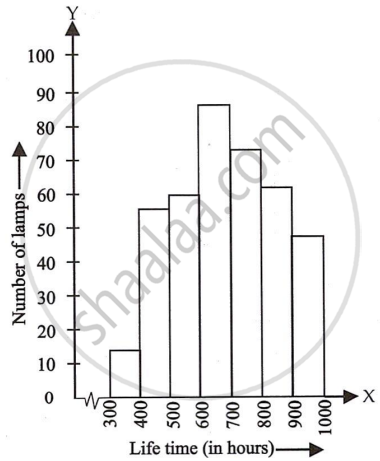
Here, 1 unit on the y-axis represents 10 lamps.
(ii) It can be concluded that the number of neon lamps having their lifetime more than 700 is the sum of the number of neon lamps having their lifetime as 700 − 800, 800 − 900, and 900 − 1000.
Therefore, the number of neon lamps having a lifetime of more than 700 hours is 184. (74 + 62 + 48 = 184)
APPEARS IN
संबंधित प्रश्न
The following data on the number of girls (to the nearest ten) per thousand boys in different sections of Indian society is given below.
| Section | Number of girls per thousand boys |
| Scheduled Caste (SC) | 940 |
| Scheduled Tribe (ST) | 970 |
| Non SC/ST | 920 |
| Backward districts | 950 |
| Non-backward districts | 920 |
| Rural | 930 |
| Urban | 910 |
- Represent the information above by a bar graph.
- In the classroom discuss what conclusions can be arrived at from the graph.
Given below are the seats won by different political parties in the polling outcome of a state assembly elections:-
| Political Party | A | B | C | D | E | F |
| Seats Won | 75 | 55 | 37 | 29 | 10 | 37 |
- Draw a bar graph to represent the polling results.
- Which political party won the maximum number of seats?
The length of 40 leaves of a plant are measured correct to one millimetre, and the obtained data is represented in the following table:-
| Length (in mm) | Number of leaves |
| 118 - 126 | 3 |
| 127 - 135 | 5 |
| 136 - 144 | 9 |
| 145 - 153 | 12 |
| 154 - 162 | 5 |
| 163 - 171 | 4 |
| 172 - 180 | 2 |
- Draw a histogram to represent the given data. [Hint: First make the class intervals continuous]
- Is there any other suitable graphical representation for the same data?
- Is it correct to conclude that the maximum number of leaves are 153 mm long? Why?
Study the bar graph representing the number of persons in various age groups in a town shown in Fig. below. Observe the bar graph and answer the following questions:
(i) What is the percentage of the youngest age-group persons over those in the oldest age group?
(ii) What is the total population of the town?
(iii) What is the number of persons in the age group 60 - 65?
(iv) How many persons are more in the age-group 10 - 15 than in the age group 30 - 35?
(v) What is the age-group of exactly 1200 persons living in the town?
(vi) What is the total number of persons living in the town in the age-group 50 - 55?
(vii) What is the total number of persons living in the town in the age-groups 10 - 15 and 60 - 65?
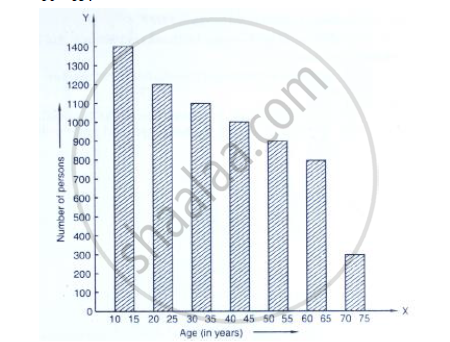
(viii) Whether the population in general increases, decreases or remains constant with the increase in the age-group.
The following bar graph (Fig. 23. 1 4) represents the heights (in cm) of 50 students of Class XI of a particular school. Study the graph and answer the following questions:
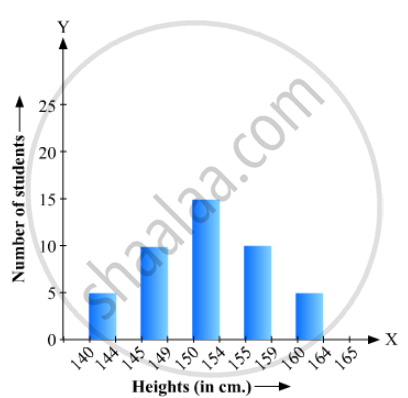
(i) What percentage of the total number of students have their heights more than 149cm?
(ii) How many students in the class are in the range of maximum height of the class?
(iii) The school wants to provide a particular type of tonic to each student below the height
of 150 cm to improve his height. If the cost of the tonic for each student comes out to be Rs. 55, how much amount of money is required?
(iv) How many students are in the range of shortest height of the class?
(v) State whether true or false:
a. There are 9 students in the class whose heights are in the range of 155 - 159 cm.
b. Maximum height (in cm) of a student in the class is 17.
c. There are 29 students in the class whose heights are in the range of 145- 154 cm.
d. Minimum height (in cm) of a student is the class is in the range of 140 – 144 cms.
e. The number of students in the class having their heights less than 150 cm is 12.
f. There are 14 students each of whom has height more than 154. cm.
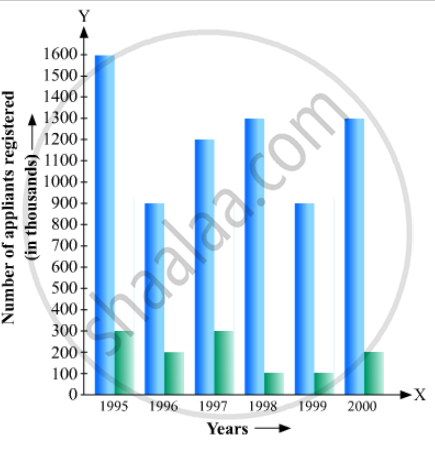
The following data gives the number (in thousands) of applicants registered with an
| Year | 1995 | 1996 | 1997 | 1998 | 1999 | 2000 |
| Number of applicants registered (in thousands) | 18 | 20 | 24 | 28 | 30 | 34 |
Construct a bar graph to represent the above data.
Draw frequency polygons for each of the following frequency distribution:
(a) using histogram
(b) without using histogram
|
C.I |
5 -15 | 15 -25 | 25 -35 | 35 - 45 | 45-55 | 55-65 |
| ƒ | 8 | 16 | 18 | 14 | 8 | 2 |
Students of a small school use different modes of travel to school as shown below:
| Mode | Bus | Car | Bicycle | Auto | On foot |
| No. of students | 142 | 98 | 50 | 34 | 16 |
Draw a suitable bar graph.
Harmeet earns Rs.50 000 per month. He a budget for his salary as per the following table:
| Expenses | Accommodation | Food | Clothing | Travel | Miscellaneous | saving |
| Amount (Rs.) | 12000 | 9000 | 2500 | 7500 | 4000 | 15000 |
Draw a bar graph for the above data.
Is it correct to say that in a histogram, the area of each rectangle is proportional to the class size of the corresponding class interval? If not, correct the statement.
