Advertisements
Advertisements
प्रश्न
The length of 40 leaves of a plant are measured correct to one millimetre, and the obtained data is represented in the following table:-
| Length (in mm) | Number of leaves |
| 118 - 126 | 3 |
| 127 - 135 | 5 |
| 136 - 144 | 9 |
| 145 - 153 | 12 |
| 154 - 162 | 5 |
| 163 - 171 | 4 |
| 172 - 180 | 2 |
- Draw a histogram to represent the given data. [Hint: First make the class intervals continuous]
- Is there any other suitable graphical representation for the same data?
- Is it correct to conclude that the maximum number of leaves are 153 mm long? Why?
उत्तर
(i) It can be observed that the length of leaves is represented in a discontinuous class interval having a difference of 1 in between them. Therefore, 1/2 = 0.5 has to be added to each upper class limit and also have to subtract 0.5 from the lower class limits so as to make the class intervals continuous.
| Length (in mm) | Number of leaves |
| 117.5 − 126.5 | 3 |
| 126.5 − 135.5 | 5 |
| 135.5 − 144.5 | 9 |
| 144.5 − 153.5 | 12 |
| 153.5 − 162.5 | 5 |
| 162.5 − 171.5 | 4 |
| 171.5 − 180.5 | 2 |

Taking the length of leaves on x-axis and the number of leaves on y-axis, the histogram of this information can be drawn as above.
Here, 1 unit on the y-axis represents 2 leaves.
(ii) Other suitable graphical representation of this data is frequency polygon.
(iii) No, as maximum number of leaves (i.e., 12) has their length in between 144.5 mm and 153.5 mm. It is not necessary that all have their lengths as 153 mm.
APPEARS IN
संबंधित प्रश्न
A random survey of the number of children of various age groups playing in a park was found as follows:
| Age (in years) | Number of children |
| 1 - 2 | 5 |
| 2 - 3 | 3 |
| 3 - 5 | 6 |
| 5 - 7 | 12 |
| 7 - 10 | 9 |
| 10 - 15 | 10 |
| 15 - 17 | 4 |
Draw a histogram to represent the data above.
Read the bar graph shown in Fig. 23.10 and answer the following questions
(i) What is the information given by the bar graph?
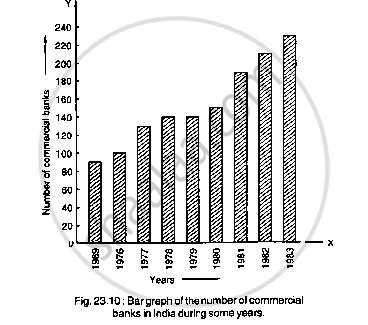
(ii) What was the number of commercial banks in 1977?
(iii) What is the ratio of the number of commercial banks in 1969 to that in 1980?
(iv) State whether true or false:
The number of commercial banks in 1983 is less than double the number of commercial banks in 1969.
Given below (Fig. below) is the bar graph indicating the marks obtained out of 50 in mathematics paper by 100 students. Read the bar graph and answer the following questions:

(i) It is decided to distribute work books on mathematics to the students obtaining less than 20 marks, giving one workbook to each of such students. If a work book
costs Rs 5, what sum is required to buy the work books?
(ii) Every student belonging to the highest mark group is entitled to get a prize of Rs. 10. How much amount of money is required for distributing the prize money?
(iii) Every student belonging to the lowest mark—group has to solve 5 problems per day. How many problems, in all, will be solved by the students of this group per day?
(iv) State whether true or false.
a. 17% students have obtained marks ranging from 40 to 49.
b. 59 students have obtained marks ranging from 10 to 29.
(v) What is the number of students getting less than 20 marks?
(vi) What is the number of students getting more than 29 marks?
(vii) What is the number of students getting marks between 9 and 40?
(viii) What is the number of students belonging to the highest mark group?
(ix) What is the number of students obtaining more than 19 marks?
Read the bar graph given in Fig. 23.17 and answer the following questions:
(i) What information is given by the bar graph?
(ii) What was the crop-production of rice in 1970 - 71?
(iii) What is the difference between the maximum and minimum production of rice?

The following data gives the amount of loans (in crores of rupees) disbursed by a bank during some years:
| Year | 1992 | 1993 | 1994 | 1995 | 1996 |
| Loan (in crores of rupees) |
28 | 33 | 55 | 55 | 80 |
(i) Represent the above data with the help of a bar graph.
(ii) With the help of the bar graph, indicate the year in which amount of loan is not increased over that of the preceding year.
The following data gives the amount of manure (in thousand tonnes) manufactured by a company during some years:
| Year | 1992 | 1993 | 1994 | 1995 | 1996 | 1997 |
| Manure (in thousand tonnes) |
15 | 35 | 45 | 30 | 40 | 20 |
(i) Represent the above data with the help of a bar graph.
(ii) Indicate with the help of the bar graph the year in which the amount of manufactured by the company was maximum.
(iii) Choose the correct alternative:
The consecutive years during which there was maximum decrease in manure production are:
(a) 1994 and 1995
(b) 1992 and 1993
(c) 1996 and 1997
(d) 1995 and 1996
The distribution of heights (in cm) of 96 children is given below. Construct a histogram and a frequency polygon on the same axes.
| Height (in cm): | 124 to 128 |
128 to 132 |
132 to 136 |
136 to 140 |
140 to 144 |
144 to 148 |
148 to 152 |
152 to 156 |
156 to 160 |
160 to 164 |
| No. of Children: | 5 | 8 | 17 | 24 | 16 | 12 | 6 | 4 | 3 | 1 |
A frequency polygon is constructed by plotting frequency of the class interval and the
Draw a histogram of the following distribution:
| Heights (in cm) | Number of students |
| 150 – 153 | 7 |
| 153 – 156 | 8 |
| 156 – 159 | 14 |
| 159 – 162 | 10 |
| 162 – 165 | 6 |
| 165 – 168 | 5 |
The lengths of 62 leaves of a plant are measured in millimetres and the data is represented in the following table:
| Length (in mm) | Number of leaves |
| 118 – 126 | 8 |
| 127 – 135 | 10 |
| 136 – 144 | 12 |
| 145 – 153 | 17 |
| 154 – 162 | 7 |
| 163 – 171 | 5 |
| 172 – 180 | 3 |
Draw a histogram to represent the data above.
